Cruise Report ONR Japan/East Sea
Hydrographic
survey
R/V Professor
Khromov KH36 22 July – 13 August 1999
September 1999, updated May 2006
Contents
A. Cruise narrative: summary, investigators, participants
A.1. Highlights: Expedition, Chief Scientist, Ship, Ports of Call,
Cruise dates
A.4. List of principal investigators
A.5. List of cruise participants
B. Description of program and measurement techniques
B.1. Approved program of the expeditionary investigations: Y. Volkov
B.2. Report of Head of Expedition: V. Luchin
B.3. Master’s Report: I. Kiselev
B.4. Meteorological observations: I. Filippov and R. Beardsley
B.5. Report of oceanographic group (CTD, salinity, oxygen):
B.5.1.V. Luchin (FERHRI) Legs 1 and 2
B.5.2 C. Mattson (SIO/ODF techniques and preliminary data) Leg 1
B.5.3 M. Johnson (SIO/ODF final calibrated data) Legs 1 and 2
B.6. Report on LADCP observations: N. Rykov, A. Shcherbina
B.7. Report of hydrochemical group: P. Tishchenko
B.8. Report of bio-optical group: S. Zakharkov
B.9. Investigation of synoptic eddies over the NW East Sea: V. Ponomarev
Appendix A: CTD data quality comments
Appendix B:
Bottle data quality comments
A. Cruise narrative
Expedition: KH36,
Legs 1 and 2
Chief Scientists
(Head of Expedition):
Vladimir
Luchin
Far Eastern Regional
Hydrometeorological
Research Institute (FERHRI)
Vladivostok,
Russia
email:
hydromet@online.ru
Lynne
D. Talley, Scripps Institution of Oceanography, UCSD
La
Jolla, CA USA
email: ltalley@ucsd.edu
Ship: R/V Professor
Khromov, Captain I. Kiselev
Ports of Call:
Pusan,
Korea
Vladivostok,
Russia
Cruise dates:
Leg
1: 22 July 1999 – 25 July 1999
Leg
2: 25 July 1999 - 13 August 1999
a.
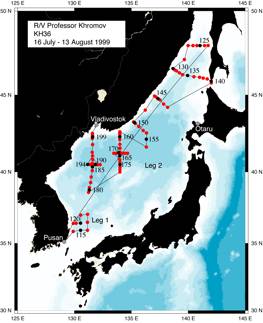
Cruise track (Fig. A.1)
b. Station sampling
90 (Leg 1 – 9;
Leg 2 – 81) CTD/24-bottle rosette stations with LADCP; sampling for
temperature, salinity, oxygen, nitrate, phosphate, silicate, nitrite, pH,
alkalinity, CFCs.
(1719 bottles
tripped)
36 biooptical
profiles
CTD station locations
and times (WOCE Hydrographic Programme format)
KH36 Japan Sea
Professor Khromov 16 Jul 1999-13 Aug 1999
SHIP/CRS
UTC EVENT POSITION
MAX NO. OF
EXPOCODE STNNBR CASTNO DATE TIME
LATITUDE
LONGITUDE DEPTH PRESS
BOTTLES COMMENTS
-------------------------------------------------------------------------------------------
90CIKH36/1-2 114 2 072299 1039 35
51.20 N 129 53.20 E 1070 1068 22 CTD#5
90CIKH36/1-2 115 1 072299 1618 35
54.20 N 130 33.20 E 1450 1472 19 CTD#5
90CIKH36/1-2 116 1 072399 0534 35
56.90 N 131 8.70 E 1100 1049 24 CTD#3
90CIKH36/1-2 117 1 072399 1044 36
30.00 N 131 8.50 E 2060 2037 24 CTD#3
90CIKH36/1-2 118 1 072399 1539 37 2.80 N 131 8.90 E
2170 2186 22 CTD#5
90CIKH36/1-2 119 1 072399 2212 37 0.90 N 130 33.40 E 2207 2186 24 CTD#5
90CIKH36/1-2 120 1 072499 0440 36
26.80 N 130 33.00 E 1950 1975 24 CTD#5
90CIKH36/1-2 121 1 072499 0838 36
25.10 N 130 9.70 E 1933 1883 24 CTD#5
90CIKH36/1-2 122 1 072499 1212 36
25.30 N 129 53.90 E 480 471 13 CTD#5
90CIKH36/1-2 123 1 072899 1855
48 0.40 N 141 45.00 E 56 52 7 CTD#5
90CIKH36/1-2 124 1 072899 2046 48 0.00 N 141 26.40 E 113 110 14 CTD#5
90CIKH36/1-2 125 1 072899 2256
48 0.10 N 141 2.20 E 852
835
15 CTD#5
90CIKH36/1-2 126 1 072999 0058 48 0.00 N 140 44.90 E 760 761 17 CTD#5
90CIKH36/1-2 127 1 072999 0321 48 0.00 N 140 25.30 E 370 360 18 CTD#5
90CIKH36/1-2 128 1 072999 0546 48 0.00 N 139 59.80 E 118 115 8 CTD#5
90CIKH36/1-2 129 1 072999 1108 47
10.70 N 139 40.00 E 611 598 15
CTD#5
90CIKH36/1-2 130 1 072999 1714 46
37.70 N 138 39.50 E 132 128 8 CTD#5
90CIKH36/1-2 131 1 072999 1851 46
33.00 N 138 50.00 E 412 413 10 CTD#5
90CIKH36/1-2 132 1 072999 2032 46
29.00 N 139 0.00 E 1105 1087 17 CTD#5
90CIKH36/1-2 133 1 072999 2334 46
22.00 N 139 14.80 E 1517 1492 24 CTD#5
90CIKH36/1-2 134 1 073099 0248 46
15.00 N 139 30.10 E 1718 1694 23 CTD#5
90CIKH36/1-2 135 1 073099 0627 46
12.50 N 139 56.50 E 1302 1288 19 CTD#5
90CIKH36/1-2 136 1
073099 1007 46 7.80 N 140 29.70 E 1239 1230 20 CTD#5
90CIKH36/1-2 137 1 073099 1337 46 5.90 N 141 0.20 E
550 562 14 CTD#5
90CIKH36/1-2 138 1 073099 1548 46 2.90 N 141 18.90 E 130 136 7 CTD#5
90CIKH36/1-2 139 1 073099 1831 45
59.70 N 141 39.80 E
76 79 6 CTD#5
90CIKH36/1-2 140 1 073099 2108 45
51.70 N 142 2.00 E 41 39 5 CTD#5
90CIKH36/1-2 141 1 073099 2215 45
45.10 N 142 1.90 E 61 61 11 CTD#5
90CIKH36/1-2 142 1 073199 2105 44
13.00 N 138 10.40 E 1440 1413 24 CTD#5
90CIKH36/1-2 143 1 080199 0122 44
26.00 N 137 50.00 E 2400 2406 24 CTD#5
90CIKH36/1-2 144 1 080199 0523 44
40.30 N 137 29.90 E 1985 1947 22 CTD#5
90CIKH36/1-2 145 1 080199 0831 44
45.90 N 137 19.80 E 1630 1612 24 CTD#5
90CIKH36/1-2 146 1 080199 1105 44
52.80 N 137 10.10 E 1045 1018 21 CTD#5
90CIKH36/1-2 147 1 080199 1256 44
56.50 N 137 2.30 E 235 231 8 CTD#5
90CIKH36/1-2 148 1 080199 2034 44 3.00 N 136 13.40 E 403 405 19 CTD#5
90CIKH36/1-2 149 1 080299
0346 43 17.90 N 135 11.80 E 315 334 19 CTD#5
90CIKH36/1-2 150 1 080299 0507 43
16.00 N 135 16.80 E 1163 1134 20 CTD#5
90CIKH36/1-2 151 1 080299 0718 43
11.90 N 135 21.80 E 3064 3186 24 CTD#5
90CIKH36/1-2 152 1 080299 1124 43 0.20 N 135 39.90 E 3492 3494 24 CTD#5
90CIKH36/1-2 153 1 080299 1629 42
45.20 N 136 2.90 E 3630 3635 24 CTD#5
90CIKH36/1-2 154 1 080299 2102 42
34.90 N 136 19.80 E 2560 2625 24 CTD#5
90CIKH36/1-2 155 1 080399 0136 42
10.00 N 136 20.00 E 3600 3650 24 CTD#5
90CIKH36/1-2 156 1 080399 0843 41
39.90 N 136 19.90 E 3528 3528 24 CTD#5
90CIKH36/1-2 157 1 080399 2340 42
39.90 N 134 0.10 E 287 280 19 CTD#5
90CIKH36/1-2 158 1 080499 0046 42
35.00 N 134 0.00 E 1200 1177 21 CTD#5
90CIKH36/1-2 159 1 080499 0239 42
30.00 N 134 0.00 E 2650 2670 24 CTD#5
90CIKH36/1-2 160 1 080499 0550 42
20.00 N 134 0.00 E 3358 3358 24 CTD#5
90CIKH36/1-2 161 1 080499 1032 42 8.90 N 133 59.80 E 3407 3412 24 CTD#5
90CIKH36/1-2 162 1 080499 1628 41
50.00 N 133 59.90 E 3547 3554 24 CTD#5
90CIKH36/1-2 163 1 080499 2054 41
35.00 N 134 0.00 E 3542 2051 24 CTD#5
90CIKH36/1-2 164 1 080599 0013 41
20.10 N 133 59.70 E 3530 3538 24 CTD#5
90CIKH36/1-2 165 1 080599 0420 41 5.00 N 133 59.90 E 3536 3536 24 CTD#5
90CIKH36/1-2 166 1 080599 1013 41
14.90 N 134 40.00 E 3575 3572 24 CTD#5
90CIKH36/1-2 167 1 080599 1412 41
15.00 N 134 26.40 E 3510 2062 18 CTD#5
90CIKH36/1-2 168 1 080599 1659 41
15.00 N 134 13.50 E 3552 3554 24 CTD#5
90CIKH36/1-2 169 1 080599 2025 41
15.10 N 134 3.10 E 3539 3542 24 CTD#5
90CIKH36/1-2 170 1 080699 0030 41
16.20 N 133 52.90 E 3510 3533 24 CTD#5
90CIKH36/1-2 171 1 080699 0418 41
15.00 N 133 40.40 E 3500 2001 24 CTD#5
90CIKH36/1-2 172 1 080699 0656 41
14.80 N 133 26.70 E 3502 3503 24 CTD#5
90CIKH36/1-2 173 1 080699 1256 40
50.00 N 133 59.90 E 3524 3532 24 CTD#5
90CIKH36/1-2 174 1 080699 1657 40
40.00 N 134 0.10 E 3493 2057 19 CTD#5
90CIKH36/1-2 175 1 080699 1944 40
30.00 N 134 0.00 E 3140 3135 24 CTD#5
90CIKH36/1-2 176 1 080699 2338 40
19.80 N 134 0.40 E 2450 2461 24 CTD#5
90CIKH36/1-2 177 1 080799 0227 40
10.00 N 134 0.00 E 1100 1111 20 CTD#5
90CIKH36/1-2 178 1 080799 0428 40 0.10 N 134 0.00 E
1030 1008 23 CTD#5
90CIKH36/1-2 179 1 080799 1738 38
35.80 N 131 14.80 E 1213 1224 18 CTD#5
90CIKH36/1-2 180 1 080799 1954 38
46.30 N 131 18.20 E 2598 2616 24 CTD#5
90CIKH36/1-2 181 1 080799 2332 38
56.10 N 131 19.00 E 3071 3059 24 CTD#5
90CIKH36/1-2 182 1 080899 0357 39
17.10 N 131 25.20 E 3040 3064 24 CTD#5
90CIKH36/1-2 183 1 080899 0845 39
40.00 N 131 28.90 E 3083 3076 24 CTD#5
90CIKH36/1-2 184 1 080899 1337 40 5.00 N 131 34.90 E 3200 3247 24 CTD#5
90CIKH36/1-2 185 1 080899 1744 40
20.20 N 131 35.20 E 3311 3313 24 CTD#5
90CIKH36/1-2 186 1 080899 2153 40
34.80 N 131 35.30 E 3320 3323 24 CTD#5
90CIKH36/1-2 187 1 080999 0156 40
50.00 N 131 35.10 E 3300 3330 24 CTD#5
90CIKH36/1-2 188 1 080999 0755 40
30.00 N 132 15.50 E 3387 3386 24 CTD#5
90CIKH36/1-2 189 1 080999 1123 40
29.90 N 132 2.60 E 3360 3367 24 CTD#5
90CIKH36/1-2 190 1 080999 1507 40
30.10 N 131 52.00 E 3300 3350 9 CTD#5
90CIKH36/1-2 190 3 080999 1913 40
30.80 N 131 50.80 E 3348 3349 24 CTD#5
90CIKH36/1-2 191 1 080999 2313 40
30.40 N 131 43.00 E 3335 3336 24 CTD#5
90CIKH36/1-2 192 1 081099 0238 40
30.00 N 131 33.10 E 3300 3322 24 CTD#5
90CIKH36/1-2 193 1 081099 0637 40
29.80 N 131 22.60 E 3309 3308 23 CTD#5
90CIKH36/1-2 194 1 081099 1101 40
30.10 N 131 10.10 E 3238 3236 24 CTD#5
90CIKH36/1-2 195 1 081099 1700 41 5.10 N 131 35.10 E 3343 3342 24 CTD#5
90CIKH36/1-2 196 1 081099 2116 41
19.70 N 131 34.80 E 3326 3314 24 CTD#5 Restart
1.33 hour later
90CIKH36/1-2 197 1 081199 0332 41
50.00 N 131 35.00 E 3100 3137 24 CTD#5
90CIKH36/1-2 198 1 081199 0855 42
14.10 N 131 34.80 E 2750 2708 22 CTD#5
90CIKH36/1-2 199 1 081199 1211 42
20.40 N 131 35.60 E 2090 2010 21 CTD#5
90CIKH36/1-2 200 1
081199 1448 42 22.80 N 131
35.10 E 900 805 18 CTD#5
90CIKH36/1-2 201 1 081199 1640 42
25.20 N 131 35.30 E 215 204 9 CTD#5
90CIKH36/1-2 202 1 081199 1745 42
28.40 N 131 35.00 E 101 97 7 CTD#5
90CIKH36/1-2 203 1 081199 1853 42
33.30 N 131 35.10 E
68 67 6 CTD#5
c. Underway sampling
pCO2
Surface temperature
and salinity
Meteorology
d. Floats
32 profiling ALACE
floats ballasted to 800 meters
See Section
B.2.1 for a detailed summary of the two legs of the cruise.
Three
separately funded sampling programs were aboard: CTD/rosette/chemistry,
bio-optical sampling, and meteorology using the WHOI ASIMET system. Two
CTD/rosette systems were aboard, both with 24 bottles. The primary sampler
carried 24 10-liter bottles, CTD#5, the Lowered Acoustic Doppler Current
Profiler (LADCP), and transmissometers. Because of its size, this was deployed
from the fantail using the A-frame. The secondary sampler carried 24 1.7-liter
bottles and CTD#3, and was deployed from the port side from the normal position
for hydrographic casts on the Khromov; it was meant for rough weather. The test
cruise consisted of 9 stations in the Ulleung Basin, with the primary purpose
of establishing procedures and setup on the Khromov. Because the positions had
to be chosen in advance of the R/V Revelle cruises for Korean clearance
purposes, they were not at exactly the same locations as the Revelle stations
in the Ulleung Basin. The primary cruise leg covered the Russian sector of the
Japan/East Sea. The purposes of the cruise leg were to map the water properties
and geostrophic circulation of the Japan/East Sea from top to bottom, the
bio-optical properties, and the plankton distribution. The water properties and
circulation of the Japanses and Korean sectors were measured in a companion
cruise on the R/V Revelle (HNRO7), immediately preceding the Khromov cruise.
CTD/rosette
station sampling was to the bottom at most stations, with the exception of
several stations in the highly-resolved eddies. Most stations were separated by
10 to 30 nautical miles. The station pattern covered most of the Russian sector.
Stations on the northern part of Yamato Rise repeated stations from the Revelle
cruise. On most stations, 24 samples were collected from top to bottom. Maximum
bottle spacing in the deep waters was 250 meters with some exceptions. Most
sampling in the upper waters was based on the many features in the CTD salinity
and oxygen and the transmissometer. An altimeter on the CTD/rosette frame was
used for the bottom approach on most stations. A lowered acoustic doppler
current profiler was used on all stations employing the large rosette (CTD#5).
A.4
List of principal investigators
1. Vladimir Luchin
(FERHRI) and Lynne Talley (SIO/UCSD): Temperature, salinity, oxygen, nutrients
(CTD and rosette)
2. Nikolay Rykov
(FERHRI), Lynne Talley (SIO/UCSD) and Peter Hacker (UH): Lowered Acoustic
Doppler Current Profiling
3. Pavel Tishchenko
(POI): Alkalinity, pH
4. Kyung-Ryul Kim
(SNU): Alkalinity, pH, Carbon 14, Delta 18O, Surface pCO2/T/S/chlorophyll
5. William Jenkins
(SOC): Delta 18O, Helium-3, tritium, neon, argon, krypton
6. Mark Warner (UW):
Chlorofluorocarbons (experimental procedure, not analyzed)
7. Sergei Zakharov
(POI) and Greg Mitchell (SIO/UCSD): Water particle size, absorption, pigments,
bio-optics
8. Robert Beardsley
(WHOI): meteorology
9. Igor Filippov
(FERHRI): meteorology
A.5. List of cruise participants
Leg 1
only
1.
Lynne Talley
(SIO) – Chief scientist
2.
David Newton
(SIO) - Programmer, LADCP, deck watch
3.
Carl Mattson
(SIO/ODF) - ODF
Tech-in-Charge/Electronics/Deck watch
4.
Doug Masten
(SIO/ODF) - Nutrient analyst/data processing
5.
Ron Patrick
(SIO/ODF) - Oxygen/Bottle data
6.
Dong-Jin Kang
(SNU) - underway chemistry, CO2 (pH by spectro.)
7.
Doshik Hahm
(SNU) - CO2 (pH by spectro.)
8.
Mark Warner (U.
Washington) - CFC
9.
DongHa Min (SIO)
- CFC
10. Clare Postlethwaite (IOS, Southampton) -
helium, tritium, neon, argon
Legs 1 and 2
1. Vladimir Luchin (FERHRI) - Chief scientist; CTD/rosette
operations, CTD console
2. Alexander Nedashkovskiy (POI) - Nutrients
3. Sergey Sagalaev (POI) - Oxygen
4. Michael Gorelkin (FERHRI) - Salinity
5. Igor Titov (FERHRI) - Electronics, Deck watch
6. Nikolay Rykov (FERHRI) - CTD/rosette operations
7. Vladimir Kraynev (FERHRI) - CTD/rosette
operations
8. Igor Zhabin (POI) - CTD/hydrographic data management, software, processing,Deck
9. Vladimir Ponomarev (POI)- CTD/hydrographic
data management, software, processing
10. Pavel Tishchenko (POI) - POI chemistry head,
CO2 (pH by EMF)
11. Ruslan Chichkin (POI) - CO2 (pH by EMF)
12. Elena Il'ina (POI) - CO2 (Alkalinity)
13. Maria Shvetsova (POI) - CO2 (Alkalinity)
14. Sergei Zakharkov (POI) - Bio-optics
15. Andrey Shcherbina (SIO) LADCP
16. Galina Pavlova (POI) CO2
17. T. Volkova (POI) CO2
18. Olga Shevtsova (POI) CO2
19. Yuri Shulga (POI) CO2
20. A Kalyagin (POI) noble gas
21. O.Vereschagina (POI) CFCs
22. Alexi Sherbinin (FERHRI) Deck
23. Sergey Yaroshev (FERHRI) Deck
24. Mikhail Danchenkov (FERHRI) PALACE
25. Igor Filippov (FERHRI) METEOROLOGY
26. K. Zhevrov (FERHRI) Salinity
27. A Sevastyarov (FERHRI) PLT
28. Anatoly Lemecha (FERHRI) Deck
Institution
acronyms
FERHRHI - Far-Eastern Regional
Hydrometeorological Research Institute, Vladivostok, Russia
SOC - Southampton Oceanograpy Centre,
Southampton, UK
KORDI - Korea Ocean Research and Development
Institute, Seoul, Korea
POI - Pacific Oceanological Institute, Far
Eastern Branch Russian Academy of Sciences, Vladivostok, Russia
SIO - Scripps Institution of Oceanography,
University of California San Diego, La Jolla, CA USA
SIO/ODF - SIO Oceanographic Data Facility
SNU - Seoul National University, Seoul,
Republic of Korea
UW - University of Washington, School of
Oceanography, Box 357940, Seattle, WA 98195 USA
UH – University of Hawaii, Honolulu, HI
USA
WHOI - Woods Hole Oceanographic Institution,
Woods Hole, MA USA
B. Description of program
and measurement techniques
B.1. Approved program of
the expeditionary investigations
(Y. Volkov, FERHRI)
FEDERAL SERVICE
OF RUSSIA ON HYDROMETEOROLOGY
AND ENVIROMENTAL MONITORING (ROSHYDROMET)
Far Eastern Regional Hydrometeorological
Research Institute (FERHRI)
PROGRAM
Expedition in the East Sea
Cruise №36 on the R/V “Pr. Khromov”
(July -
August 1999)
Vladivostok 1999
1. Registered
number of approval to conduct the expedition
The expeditionary investigations
in the East Sea in the cruise №36
on the R/V “Pr. Khromov” is being
conducted within the frame of program “The Seas of Russia”
and International project CREAMS
(Circulation Research of the East Asian Marginal
Seas) on the basis of agreement being concluded between FERHRI
ROSHYDROMET and Washington University
(Seattle, USA) of 12. 03. 1999 and approval for the cruise implementation № 009 – 4/384 of 08. 12. 1998.
2. Period of works
The cruise of 26 days duration
is to be conducted in the East Sea within the
economic zones of Republic of Korea and Russia from July 16 till August 11, 1999.
3. Ports of call
In order to
embark/disembark the foreign specialists,
to load scientific equipment
and to bunker with fresh water, two calls at the port of Pusan (Republic of Korea)
have been planned. The
foreign specialists will bee
disembarked at p. Pusan on the work completion within the
economic zone of Korea (21
– 25. 07.), the within the
Russian economic zone the
observations will be conducted
by the Russian specialists.
4. The name of the vessel or any marine
craft on which head of expedition will be present
Head of expedition
will be on the R/V “Pr. Khromov”, displacement 2140 tons,
built in 1983 (Finland).
5. Communication
In the cruise the following communication
is to be used
- radio/telephone,
- short waves
approved for the ship
radiostation,
- Ultra Short Waves -
international frequencies.
6.
Main objectives
The expeditionary investigations are
being conducted for the aim of
- determination of the full vertical
structure of the main
components of the East Sea circulation, including
the Liman current, Eastern
Korean warm current, Tsushima
current, as well as the possible deep-sea west boundary current and other
components of the deep-sea
circulation that is likely related
to the subsurface circulation;
-
study of formation conditions
and subpolar front development in the central
part of East Sea and bottom topography
possible influence,
- obtaining of the
complete synoptic picture for
vertical
interstratification
structure over the East Sea,
-
determination of possibility to use chemical tracers including nutrients, DO and freons so that to reveal the main elements of large-scale
circulation and assessment of the North-West and North parts of East Sea in renewal of the intermediate
and deep sea waters;
-
vertical structure study, at least, of the eddy in the subpolar convection region or
subpolar front, and one more in the
Eastern-Korean warm current southward
the subpolar front.
In
order to obtain the above mentioned, the
objectives to be solved are
as follows:
-
to carry out the oceanographic survey in the North-West
East Sea making measurements of
temperature, salinity and sampling for
chemical analysis;
-
to conduct a set of hidrometobservation.
7.
Types of standard
and special observations and works conducting in the cruise to solve the tasks.
7.1. Standard observations:
In the cruise a complex of
standard
hydrometeorologic,
oceanographic and hydrochemical observations
are being conducted.
7.2. Special observations
7.2.1.
Sampling of sea water to determine
the chemical tracer content (C14, O18, freons, He-3, T, Ne, Ar, Kr).
8.
Volume of works and observations, addresses and term for information
to be transferred, including
international exchange.
8.1. Meteorological observations
In the cruise a complex of
standard
hydrometeorological
observations on the program of the vessel
station of class 2 as to “Metodical
instructions…” GGO, parts I – II,
issue 1983 are being produced.
In
addition to the complex mentioned the following
is being produced
-
observation of anomalous
events in the atmosphere;
-
visual observation of sea water petroleum
pollution and oil products.
Information:
1. Transferring of
meteorological
observationsby KN-01 in the
address of “Moscow - Weather”, “Vladivostok - Weather”, “Vladivostok –
213421-Thunderstorm HMC and foreign
RMC on the vessel way for 4 basic terms.
2.
Transferring of storm
warning and data on hazard events is being produced by the open text in address of “Vladivostok
- Weather”, “Moscow –
Weather”.
8.2.
Oceanographic observations
8.2.1.
Oceanographic stations on the sections are being carried out through out the bottom.
8.2.2.
Observations at the stations
-
t oC and salinity measurements
by CTD probe throughout
the depth of each
station probing;
-
sea water sampling
for hydrochemical analysis at the level of 10, 20, 30, 50, 75, 100, 125, 150, 200, 250, 300, 400, 500, 600, 700, 800, 1000, 1200,
1500, 2000, 2500, 3000 at the each station;
-
sea water color and transparence determination
on the light time of a
day.
Information:
Transferring of data on sea t oC
and salinity at the levels by KN-05,
KN-06 in the address of “Moscow – Weather”, “Vladivostok – Weather”, “Vladivostok – 213421 –
thunderstorm HMC”.
9. Devices and
equipment used, including additional
ones.
-
standard hydrometeorological devices;
-
air probing station
“Vaisala”;
-
hydroprobing “SBE 911 plus CTD” with 24, 10L water sample bottle;
-
salinometer “Autosal 8400A”;
-
installation “Biamperometric DO Titrator” to determine dissolved O2 and total alkalinity;
-
automatic analyzer “Technicon”
to determine nutrients;
-
analyzers to determine
content of CO2 and freons;
-
PC.
10. Procedure
of obtained results processing
Data on CTD
measurements obtained in the cruise are being processed
on the vessel in operative
regime.
Hydrochemical analysis of the water samples
are being carried out
partially on board and partially at the
coastal laboratories.
On processing all
results obtained are being
recorded in the special
formats and carriers.
11.
Terms of copies on observations for environmental
parameters transfer at Russian
State fund of data on environment
11.1. On the date of the vessel arrival the cruise report (3 copies) is being
presented at the Marine
Department and Base of Fleet by Master and Head of
expedition. The cruise report
after its control by Departments mentioned above is being sent at ROSHYDROMET.
11.2. Scientific report including analysis of the work carried
out and assessment of the data quality (2 copies, including original)
is being given in library of FERHRI.
Data on observations
after analysis at the
coastal laboratories are being presented at Regional
Oceanographic data Center.
Terms of information
providing is determined by
agreement of the parties
for the data exchange.
12.
Information on RF representative authorized by
Ministry of Science RF
The representative participation in the cruise is not considered.
13.
Information on hydrometeorological
observations and environment pollution
13.1. The operative
information processing and propagation
is being produced during the cruise under the requirements existing
and transferred in the
addresses painted out after each type of
observations within the present
program.
13.2. Tables of the results of sea water pollution
with oil products are being sent to Monitoring Department FERHRI.
14.
Participants of the expedition
To solve the tasks of the
program the following specialists
will take part in the cruise FERHRI - 10 persons,
PIO - 14, USA - 9, Republic
of Korea -
2.
Director of FERHRI Yu. Volkov
B.2. Report of head of expedition (V. Luchin, FERHRI)
B.2.1 Progress and
details of the cruise
implementation
Expedition cruise № 36 on the R/V “Professor Khromov” was being conducted
on the program of the seventh joint Russian
– Korean expedition within the frame of international
project creams under the plans of operative
and productive works and international scientific cooperation
of ROSHYDROMET on the basis of agreement
between FERHRI and University of Washington and Scripps
Institution of Oceanography California
University USA of 12. 03. 1999
and approval for the cruise N
OC9 – 4/162 of 23. 04. 1999.
Expedition investigations have been conducted so that to obtain the
natural data for
-
determination of full
vertical structure of the main circulation components
in the East Sea, including the Liman
current, Eastern –
Korean warm current, Tsushima
current, as will as the deep boundary
current and other deep
circulation components;
-
study of formation
conditions and subpolar front
development in the central
part of East Sea and bottom topography
possible influence;
-
obtaining of the
complete synoptic picture for
vertical
interstratification
structure over the East Sea
-
determination of possibility
to use chemical tracers
including nutrients, dissolved oxygen,
freons so that to reveal the main elements of large – scale
circulation and assessment of
North-West and North parts of East Sea in renewal of the intermediate and deep sea waters;
-
vertical eddy structure
study in subpolar convective
region and subpolar front.
In order to obtain the above
mentioned the objective to be solved are as follows
-
to carry out the oceanographic survey of deep sea
regions in South –West, central and
northern part of East Sea with making
measurements of t oC and salinity
by CTD – probe and sampling
of water for the
chemical analysis;
-
to conduct a set of standard
hydrometeorological on the program of the vessel station of class II, as well as additional observations
on the anomalous events in the atmosphere
and sea water oil and oil products
pollution;
-
to process and record on the
carries all kinds of observations;
-
to prepare the scientific
report including all types of studies.
The R/V “Professor
Khromov” went into the cruise №
36 on July 16, 99 and
proceeded to the port Pusan to embark the researchers and to load the
scientific devices.
On July 22 loading on board the expedition equipment
and embarking the specialists
from USA and Republic
Korea the vessel left Pusan and proceeded
in the region of work in South–West
East Sea (Uleung Basin).
In the region mentioned from July 22 till July 24 there were
carried out 9
oceanographic
stations. Further the vessel
went to Pusan to
disembark the foreign participants
of the cruise on leaving Pusan the
following works were produced
-25-29.07 - transition to the Tatar Strait;
-29.07 - section across 48
0 00’ N,
from 141 0 45’ to 140 0 00’ E;
-29-30.07 - transition to position 46 0 38’ N, 138 0 40’ E;
-30-31.07 - section
from position 46 0 38’ N, 138 0 40’ E to 46 0 00’ N 141 0 40’ E;
-31.07 - section in the Laperuz Strait;
-31.07-01.08 -
transition to position 44 0 13’ N, 138 0 10’ E;
-01-02.08 - section
from position 44 0 13’ N, 138 0 10’ E to 44 0 57’ N 137 0 03’ E;
-02.08 - transition to
position 43 0 18’
N, 135 0 12’
E;
-02-03.08 - section
from position 43 0 18’ N, 135 0 12’ E to 41 0 40’ N 136 0 20’ E;
-03-04.08 - transition
to position 42 0 40’ N, 134 0 00’ E:
-04-07.08 -
section across 134 0 00’ E from 42 0 40’ to 40 0
00’ N, including section through
the eddy across 41 0 15’ N from 134 0
40’ to 133 0 27’ E:
-07-08.08 - transition
to position 38 0 36’ N, 131 0 15’ E;
-08-09.08 - section
from position 38 0 36’ N, 131 0 15’ E to 40 0 05’ N 131 0 35’ E;
-09-12.08 -
section across 131 0 35’ E from 40 0 05’ to 42 0
33’ N, including section through
the eddy across 40 0 30’ N from 132 0
15’ to 131 0 10’ E;
-12.08 - analysis completion
and information processing;
-13.08 - arrival at Vladivostok.
The weather conditions
during the first twenty
days, mainly, are not
favorable for the work
planned to be performed. The persistent wind was from 10 to 15 m/s, the sea waves made difficulties in producing of the
oceanographic stations because of the heavy rolling
and pitching.
The weather conditions
of the last cruise
week were favorable for o work.
Program of work has been made
completely, excluding 3
missed oceanographic stations that were in the
territorial waters of Japan. In the cruise the content of carbon dioxide was being measured continuously in the sea
surface layer. The sea water sampled from the engine pipeline
and with the help of thermoisolated hose it reached the hydrology
laboratory where the measurement
of the carbon dioxide,
chlorofile, t0C and salinity
were done.
Hydrometeorological observations have been performed 4 per a
day at 00, 06, 12, and 18 hours GMT.
In the cruise № 36
2 Korean, 24 Russian and 9
specialist of USA took part.
Scientific equipment
-
standard hydrometeorological equipment;
-
probing station of the atmosphere “Vaisala”;
-
hydroprobe “SBE 911 plus CTD” with 24 10L bottles
-
salinometer “Autosal 8400A”;
-
“Biamperometric D.O. Titrator”
to determine the dissolved
oxygen and the total
alkalinity;
-
automatic analyzer “Technicon”
to determine the nutrients;
-
analyzers to determine CO2, freons;
-
computers
B.2.2 Volume of work,
actual cruise program implementation
Approved
program has been made completely taking into account some amendments produced
by the proposal of POI and Scripps Institution regarding the order of the
route going in the area of eddy
polygons.
Figures
A.1 and B.2.1 and accompanying station list of the present report show the
route of the vessel going and station positions.
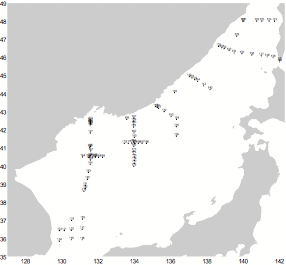
Figure B.2.1 Cruise track of the R/V Professor Khromov, KH36 (16
July – 13 August 1999).
In the
cruise the following type and number of
observations have been carried out
Oceanographic stations including t0C and salinity
measurements by CTD probe from surface to the bottom
- 90;
Sea water samples to determine
-salinity
- 90 station, 1719 samples;
-dissolved oxygen
-
90 st., 1719 s.;
-pH
- 88 st., 1200 s.;
-total alkalinity
-
88 st., 1200 s.;
-silicate
-
90 st., 1719 s.;
-phosphate
-
90 st., 1719 s.;
-nitrate
-
90 st., 1719 s.;
-nitrite
-
90 st., 1719 s.;
-freons
-
51 st., 681 s.;
-helium
-
37 st., 325
s.;
-tritium
-
34 st., 278 s.;
-O18
-
40 st., 325 s.;
-C14
-
5 st., 54 s.;
-chlorophile
-
89 s.;
Biooptical observations
-spectrum suspension absorption
-
36 st., 192 s.;
-spectrum of dissolved
substance
-
8 st., 44 s.;
-content of chlorophile
“a”
-
36 st., 188 s.;
-content of suspended
organic matter
-
33 st., 141 s.;
-sea water transparence
within the red and blue spectrum field -90 st.;
-sea water transparence
on Sekki’s disk - 28 st.;
-urgent hydrometeorological observations -
86;
-storm warning
-
3.
On the cruise completion and under agreement between
parties participants in the expedition, the Russian and American Parties have
been presented the data of CTD probe
“SBE 911 plus CTD” measurements
altogether with information
of hydrometeorological
observations.
Data
on the current measurements using LADCP, sea water hydrochemical analyses and
continuous measurements of CO2 content will be transferred to the
Russian Party on processing completion in the coastal laboratories of Seoul
National University and Scripps
Institution of
Oceanography
California University USA.
The
cruise program is fully completed.
Data have been recorded on the carriers and transferred in Regional
Center of Oceanography data and library of FERHRI.
B.2.3 Description of
scientific and technical group work and crew in the expedition regarding the
cruise program implementation.
Well
coordinated work and full understanding of all scientific groups and the
ship departments allowed to solve
all tasks in due time.
B.2.4 The most important results obtained
The basic result of the cruise is the comprehensive
oceanographic data massive obtaining
(hydrophysical,
hydrochemical,
biooptical, current speed, inert gas content and so on) on the up-to-date level.
For the first time in the North and North-West
part of the East Sea detailed instrumental
current measurements and other
oceanographic features measurements from the sea surface to the bottom have
been performed. Measurements and sea water sampling at the near
bottom levels have been
produced by 4-8 meter over the bottom.
High accuracy measurement
data of hydrophysical and
hydrochemical
parameters allow to clarify
essentially the spatial structure
of water masses. They will be very
useful as standard data on choosing criteria to estimate the
massive quality of historic
oceanographic
information. The results obtained
will be used to solve the problem of intermediate deep water formation in the East Sea.
The preliminary analysis
of the data obtained
in the cruise showed
that the Tsusima current
effect is not limited by the sea part southward of the subpolar front.
This water effect is being marked along all the East Sea water area. In
the layer of 1000–2000
meter there are fixed the
waters of the lower salinity estimations
(less than 34,066 0/00). It is likely due to the convective processes in the fall
winter period and further
water transformation in accordance
with their migration within the limits.
The current measurements
obtained allow to clarify
and add information available
on the elements of total sea water
circulation and more detail
investigate the dynamic processes
taking place in synoptic
eddies the obtained preliminary
results are an evidence
that the anticyclone current
system in the eddies
studied propagates to the near bottom levels
(about 3000-3200 m.).
Biooptic data allow to establish the models describing the level of the
primary organic matter producing
in the East Sea.
At some oceanographic
stations in the region
studied with the depths to 3000 m and lower there has been registered not high but analytical essential silicate decreasing
at the near bottom levels.
Nitrite content in the sea, excluding
the layer of 100-200 m is to
analytical zero. At the same time at some stations in the near bottom
layer (at the level of 1000-2000 m) there has been
recorded the persistent nitrite
presence.
B.2.5
Recommendations on improvement of the expedition arrangement
and the vessel equipment
The experience of
expeditionary works, carried out in the cruise,
shows that under favourable weather conditions the vessel is enough
suitable to produce oceanographic
observations on planning the cruise it
is necessary to consider
more time to produce deep sea oceanographic
stations and storm weather
conditions.
B.3. Master’s Report: I. Kiselev
B.3.1.
Cruise navigation peculiarities.
The vessel route of the cruise № 36 took place in the
central part of the East Sea, well studied regarding the navigation problems.
Fig. 2.1 & tabl. 2.1 show the actual vessel route & positions of
oceanographic stations taking into account some amendments made by the Japan
party regurst.
The
weather conditions in the cruise, mainly, didn't hinder to conduct
the studies planned.
In
the cruise the synoptic data have been received regularly. Navigation charts
& manuals for sailing have been corrected by requirements IM, PRIP, NAVIP,
NAVAREA. The requirements of good marine practice have been user. The control
on the vessel hull non water permeability & stability has been produced
continuously.
On
July 18 at 10-40 o/clock the vessel arrived at the pilot anchorage
of the p.Pusan & at 11-50 o/clock was put along Yong-Ho berth
near by the r/v “Roger Revelle” USA.
On
July 22 at 14-00 after taking on board the Russian specialists {14 persons},
the American & Korean specialists {10 persons}, two Navy observers of R.Korea as well as expeditional
equipment ship left the p.Pusan & proceeded in the region of the work in
the Korean economic zone.
On July 25 at 09-00 on the joint expeditional stage
completion, the vessel came back to Pusan to disembark the foreigner
participants of expedition & at 10-10 it was put along the passenger berth № 1.
On July 25 at 19-00 after bunkering with the fresh
water, the vessel left Pusan & proceeded in the Tatar Strait.
On August 13 at 08-00 on the oceanographic survey
completion on the sections in the North & central parts of East Sea &
eddy polygons the vessel arrived at the inner road of the port Vladivostok.
B.3.2.
Methods & accuracy of the vessel position determination
To determine the vessel position the following
technical devices have been use:
-
HCC
”NAVSTAR XR-4”, {Gold Star, R. Korea};
-
Radar
“OKEAN”, 3 sm {Russia};
-
Radar
“OKEAN”, 10 sm {Russia};
-
Radar
“FURUNO”, 3 sm {Japan};
-
Giro
compass “VEGA-2” {Russia};
-
Doppler
lag “FURUNO” {Japan};
-
Echo
sounder “NAL-M-3B”, 500 m depth {RUSSIA};
-
Echo
sounder “ELAK ENIF”, 15000 m depth {Germany}.
Within radiolocation visibility of the coastal things
the position determination has been produced by radar. Off shore the main
device to fix the place was HCC “NAVSTAR XR-4”.
All available on board navigation equipment was reliable
operation in the cruise & ensured accuracy of the place position &
depth required to sample the sea water.
B.3.3.
Peculiarities in the expedition work
Having strong wind more than 10 m/s, decreasing the
angle of wire cable declination & ensuring the water samples of great
volume, in addition, avoiding damage of equipment & devices having heavy
rolling, few oceanographic stations have been carried out with the help of the
main engine, keeping the vessel by the bow against the wind & wave.
The weather conditions during the first twenty days of
the cruise, mainly, were not favourable for the work implementation. When
strong wind being {more than 10 m/s}, because of heavy rolling & pitching
implementation of the oceanographic stations by CTD probe of a great volume
using stern P- frame was very difficult to be executed.
B.4. Meteorological observations (I. Filippov and R. Beardsley)
Meteorological
measurements were made by FERHRI (Filippov) and by Woods Hole Oceanographic
Institution (Beardsley).
A
separate report of the WHOI measurements is found at the website:
http://www.whoi.edu/science/PO/japan_sea
B.4.1 Program of work
(FERHRI)
Program of the cruise 36 has been planned to execute a
number of hydrometeorological observations on the program of the vessel station class II under
“Methodical
instructions to produce meteorological
and actinometry observations on the research vessels“ part
I,II.,1983, as well as the
observations on the anomalous
events in the atmosphere
and visual monitoring on the sea surface
pollution of oil and oil products.
Meteorological data are being transferred by code KN-01 for 4 main intervals
in the address of Moscow- Weather, Vladivostok-Weather
and foreign centers, storm
warnings are transmitted by open text in the address of Moscow- Weather and
Vladivostok-Weather.
B.4.2 Characteristic of the work to be executed
Meteorological observations were
produced in the cruise
from July 16 till
August 13, 1999, excluding
the vessel staying at Pusan, at the main synoptic period 00, 06, 12 and 18 hours GMT.
Urgent hydrometeorogical observations have been carried out in total - 86 and sent the same quantity
in the addresses corresponding.
3 storm warnings have been sent, as well.
All information has been controlled and
recorded in tables
(THM-15).
B.4.3 Equipment, devices,
characteristic of work, position
and change in the cruise.
When meteorological observations producing,
standard Russian meteodevices and
automatic meteostation “Midas 321”
(Finland) developed under requirements
of World Meteorological Organization (WMO) have been applied.
The atmospheric pressure was measured
by aneroid barometer M-67 fixed in meteorological
laboratory at the altitude 5 meter over the sea level.
Baric tendency feature
was determined by week
barograph M-22H fixed nearly
aneroid barometer .
The air temperature was
measured by aspiration psychrometer MB-4M fixed on the turn arms at the distance of 3
m from the vessel
side at the altitude 12 m
over the sea level.
The wind speed and direction were
measured by sensors of automatic station “MIDAS-321”
fixed on the fork mast at the
altitude of 18 m over the sea level.
The sea surface
layer was measured by mercury thermometer TM-10 being put in standard safeguard covering in the vessel bow part on the windy
leeward side.
The atmospheric precipitation
quantity was determined by
automatic weather station “MIDAS-321”.
Observations on clouds,
visibility, atmospheric events, wave
direction and period were
produced by visual from the upper bridge.
The wave altitude was
determined from the stern duck.
Hydrometeorological information was processed by IBM PC/AT using program
METEO-SW.
B.4.4 Evidence on control
and devices calibration
Table 4.1 gives
dates of control on the meteorological devices used in the cruise
Table 4.1
|
Name
of device |
Type |
Factory
number |
Date
of control |
|
Barometer-aneroid Week
barograph Psychrometer
aspiration Anemograph Anemometer
(manual) Mercury
thermometer |
M-67 M-22H MB-4M M63M-1 MC-13 TM-10 |
1057 19036 6269 40 6796 7573 |
January
1999 January
1999 January
1999 February
1999 January
1999 January
1999 |
The automatic meteorological
station “MIDAS-321” readings were
regularly controlled by standard
meteorological devices in the cruise
B.4.5 Methods of observations
and processing
Meteorological observations and
obtained data processing have been conducted under the Russian methodical
instructions as to WMO standards.
B.4.6 Data on hazard and especially hazard
hydrometeorological events
In the cruise the hazard events
were observed as follows
23.05.1999
in the position 40
0 12’ N, 134
0 37’ E - fog, visibility
- 400 m,
26.05.1999
in the position 41
0 15’ N, 134
0 06’ E - fog, visibility
- 400 m,
27.05.1999
in the position 41
0 16’ N, 134
0 31’ E - fog, visibility
- 400 m.
B.5. Report of oceanographic group (CTD, salinity, oxygen)
B.5.1. CTD,
rosette, salinity, oxygen data on Legs 1 and 2 (V. Luchin)
B.5.1.1
Program of work
In the cruise the oceanographic observations have been
carried out under the approved program taking into account a few amendments of
CTD stations position & the order proceeding along the route. Figure 1
& accompanying table show the scheme of route & station positions.
The oceanographic work consisted of:
-
sea
water temperature & salinity measurements by CTD probe “SBE 911 plus CTD”
from the sea surface to the bottom making sea water samples at the given levels
{not always standard} by twenty four 10 l bottles for the hydrochemical
analyses;
-
sea
water salinity determination in the laboratories by salinometer “Autosal 8400”;
-
current
measurements at oceanographic stations {while up & down the probe} by
special acoustic equipment {LADCP}.
B.5.1.2.
Characteristic of the work carried out {CTD measurements, water sampling&
current measurements at the stations}.
In order to make measurements of the temperature,
salinity and seawater pressure at the stations from the sea surface throughout
the bottom CTD probe NBIS of model MK III as well as rosette to the probe “SBE
911 plus CTD” were used. The water samplers for hydrochemical analyses were
fulfilled at the chosen levels by twenty four 10 l bottles. In the laboratory
the sea water salinity was determined by salinometer “Autosal 8400”.
The current
measurements at the stations {while up &down the probe } were fulfilled by
LADCP.
CTD data, salinity & current measurements were
produced by using software developed in Scripps Oceanographic Institute of
UCSD. The data processing were performed by IBM PC. All data were recorded on
the carriers as well as CDROMs & Zip disks. The CTD data were recorded on
VCR cassettes.
In the cruise there were fulfilled 90 oceanographic
stations in total with temperature, pressure measurements {depth of the devices
submerging} & salinity {conductivity} by CTD probe from the surface throughout
the bottom. At all oceanographic stations {irrespectively from the depth of
position } the last level of observations was at the distance of 4-10 m from
the bottom.
B.5.1.3 Hydrochemical observations
B.5.1.3.1. Devices
Salinity was determined both by CTD detector
{continuous profile throughout the depth } & by salinometer at each station
{control determination}.
In the cruise two salinometers “Autosal 8400 A”
company “Guildline Instruments LTD” {Canada} № 53-503 &№48-263
were used. Instrumental accuracy of this type salinometers is not worse than -+
0.001 0/00 while making a set of sample standardizing at
each station & not worse than +- 0.003 0/00
for 24 hours of work not including restandardizing.
High accuracy & persistence in data obtaining by
the salinometer was achieved by the presence of two pain of platinum-radium
electrodes in the measurements chamber & built-in high frequency thermostat
{volume of water tank – 18 l} having the range of given temperature 18-330C
with the interval in 30C, accuracy 0.020C. Moreover,
double meanings of relative conductivity of standard & samplers are used
that increases the resolution device ability.
Salinometer №53-503
is connected with PC through builtin interface RS232. The data putting from
salinometer display №48-263
to the computer is produced by hand.
B.5.1.3.2. Methods of determination & salinity
data processing
The control salinity samplers were chosen at each
stations at all levels of the bottles working {maximal number – 24}.
Levels of sample taken were defined by an operator of
CTD probe, taking into account the element profile depth change, determined by
the probe detector {temperature, salinity, dissolved oxygen & fluorimeter.
Samples were thermostatted in the laboratory not less
than 8 hours before determination beginning. The experiment demonstrated that
having instable temperature in the laboratory such thermostating is not
sufficient, the speed of sample going through salinometer should be decreased,
as a result, the time spent for the sample analysis abruptly increases, &
the data stability decreases. Therefore, on the r/v “Pr. Khromov” the sample
water thermostatting was additionally applied, directly before the temper.
determination approximately by 1°C lower the temperature marked in salinometer
thermostatt.
Before & on completing of each set of samples, the
salinometer was calibrated as to the normal water of IAPSO standard, series
P134 {USA}. It was produced a few readings of each sample, assuming differences
in readings are as follows: 000003 for normal water & 0.00005 for the
sample of double conductivity. The sample salinity estimations were obtained
not accounting the device heated itself.
The
intermediate data were processed under the program – salinity was
obtained in consideration of self-heating, as well as the estimation difference
between the salinity estimations by a salinometer & CTD detector that could
be used on further calculation after a critical control.
In the cruise at 90 stations there were analysed in
total 1719 samples.
B.5.2 CTD, rosette, salinity, oxygen data on Leg 1 (C. Mattson, SIO/ODF)
This
is a continuation of cruise HNRO7. Refer to the HNRO7 Prelim Cruise Report for
preexisting conditions.
B.5.2.1 CTD data
and rosette
CTD
data were recorded on IBM PC's. Digital backups were made on CDROMS and Zip
disks. Analog backups were made on VCR cassettes.
CTD instrument
numbers:
NBIS
Model MKIII ODF CTD#3
sta 116,117
NBIS
Model MKIII ODF CTD#5
sta 114,115,118-122
Large rosette:
The large rosette was
used for Stations 114-115, 118-122 and consisted of:
NBIS MKIIIB CTD s/n 01-1070
(ODF ctd#5)
Sensormedics Oxygen
Sensor s/n 6-02-08
STS 24 bottle rosette frame
24pl Seabird pylon model
SBE32 s/n 3212613-0164
SIO made bullister style 10
liter bottles
Benthos Pinger model 2216
s/n 1275
Simrad Altimeter model 807
s/n 0711090
STS Battery Pack for
Altimeter
RDI LADCP CS-150KHZ s/n 1546
LADCP Battery Pack
Wetlabs Cstar 25cm
transmissometer c/n CST-244DB
Wetlabs Cstar 25cm
transmissometer c/n CST-245DB
CTD #5 has dual sensors
mounted on twin turrets - two
identical Temperature channels and two identical conductivity channels.
CTD sensors soaked in
distilled water between all casts.
Swapped sensor pair in
config file for onboard CTD and Bottle data reports.
Cond#1 sensor has a
pressure effect on deep case and will require a pressure fit correction.
Bottles:
10L Bullister style SIO manufactured.
Bottles serial numbered
1-24 corresponded to the pylon tripping
sequence 1-24 with the
first bottle tripped being bottle #1.
Oxygen:
Oxygen data interfaced with
the CTD and incorporated into the CTD data stream.
Sensormedics Oxygen
Sensor s/n 6-02-08
Transmissometer:
Wetlabs Cstar 25cm
(Blue) Transmissometer c/n
CST-244DB
Wetlabs Cstar 25cm
(RED) Transmissometer c/n
CST-245DB
LADCP:
RDI LADCP CS-150KHZ s/n
1546
Small Rosette.
The small rosette was used on sta 116, 117 and consisted of:
NBIS MKIIIB CTD s/n 01-1095
(ODF ctd#3)
Sensormedics Oxygen
Sensor s/n 90222-01 sta 116
Sensormedics Oxygen
Sensor s/n 6-02-07 sta 117
FSI OTM s/n 1322
STS small 24 bottle rosette
frame
36pl Seabird pylon model
SBE32 s/n 3216715-0187
Seabird Temperature Sensor
SBE35 s/n 3516590-0011
24 SIO made bullister style
2.7 liter bottles
Benthos Altimeter model
2110 s/n 156
CTD#3:
New Conductivity sensor s/n
P51 was installed at beginning of trip.
Conductivity sensor cleaned
prior to sta 117
PRT#1 has what appears to
be a long response time of about 1 second or more.
CTD sensors soaked in
distilled water betweem all casts.
Bottles:
2.7L Bullister style SIO manufactured.
Bottles serial numbered
1-24 were tripped in sequence.
The pylon was a SBE32 36
place model so certain pylon positions were skipped. This was done
automatically by the acquisition program and tripped in the following order:
01 02 04 05 06 08 10 11 13
14
16 17 19 20 22 23 25 26 28
29
31 32 34 35
Oxygen:
Oxygen data interfaced with
the CTD and incorporated into the
CTD data stream.
Sensormedics Oxygen
Sensor s/n 90222-01 sta 116
Sensormedics Oxygen
Sensor s/n 6-02-07 sta 117
Thermometers:
No DSRT's
Transmissometer:
No Transmissometer
LADCP:
No LADCP
Winches: The CTD winch had a 9mm single conductor EM cable with
approx 4700M of wire.
B.5.2.2 Salinity
Salinometer types
Serial numbers
Guidline
8400A Autosal
55-503
Guidline
8400A Autosal
48-263
Standard seawater: Batch P-134
Autosals were configured for computer-aided measurement. The data was
acquired on a PC. #48-263 had an intermittent display problem that was repaired
after box #116. The serial interface then stopped working. The Autosal
operation was then switched to #55-503.
#48-263 stations
114-117 27 deg bath
temp
#55-503 stations
118-122 27 deg bath
temp
B.5.2.3 Oxygen
Oxygens were run all stations using a Dosimat UV-endpoint detection
automatic titration system. There were no major problems. The titrator employed a Brinkman
Dosimat 665 automatic burette and an Ultraviolet detection system interfaced
with a PC for data acquisition and control.
B.5.3 CTD final calibration comments (M. Johnson, SIO/ODF)
General comments: As of 2 November 2004, these KH36 CTD data (90 stations)
are final. Calibrations have been
carefully checked, using overlays of deep theta-salinity profiles plus surface
salinity and sigma theta plots vs. pressure. The missing data from some of the steeper thermoclines of
the first 9 casts have been interpolated; all interpolated/extrapolated data
are quality-coded 6. The software problem that omitted this data was fixed
prior to the start of the cruise.
Oxygen corrections from the preliminary data sent in 1999 have been
applied here as a courtesy; all CTD oxygen data are coded 1 (uncalibrated).
The
CTD-5 secondary T/C sensors were used as the "better" pair; both
sensor pairs had significant noise on their upcasts. The numerous offsets and higher noise level on the T1/C1
downcasts outweighed the down/up "split" seen on the T2/C2 pair:
upcasts were offset from 0 to -0.004 PSU vs downcasts below the thermocline on
this cruise. The calibrated
downcast CTD salinity data were fairly consistent. The bottle salinity data had numerous standardization
issues. An attempt was made to
weed out the standardization problems, which seemed to be worse during the
first 20 casts of the cruise. The
remaining salinity data were used to determine final calibrations for the CTD
data.
CTD-3,
with yet another new conductivity sensor, was used for stations 116 and 117;
otherwise, CTD-5 (with dual T/C sensors) was used. The new CTD-3 C sensor had a + drift with time, both down
and up casts, but less than the previous new sensor used for only station 113
on HNRO7. An extra S(P**1)
correction was applied to the downcast salinity, based on comparison of
"final" corrected salinity to the upcast bottle data. Stations 116 and 117 had different
corrections applied, because the sensor was "cleaned" between the
casts in an attempt to stop the drift.
The deep data are consistent with nearby casts.
Detailed calibration comments:
KH36 CTD Configurations:
NBIS MKIIIB CTD: s/n 01-1095 (ODF CTD#3) sta 116,117
Pressure s/n 77011
T1 s/n 15778 (T1 apparently has a
long response time of 1+ seconds)
T2 FSI OTM s/n 1322
C1 s/n P62 (new/installed at
beginning of cruise; cleaned between 116/117)
C2 N/A
NBIS MKIIIB CTD: s/n 01-1070 (ODF CTD#5) sta
114,115,118-203
Pressure s/n 77017
Dual T/C Sensors mounted on twin
turrets:
T1 s/n 15407 (hnro7/sta.92: T1 jumps
abt. +0.001 3300m down/back 3000m up)
C1 s/n O16 (Prs. effect on deep
casts, requires a C(P) corrxn).
T2 s/n 17534
C2 s/n O24
Dual Wetlabs Cstar 25cm transmissometers - only on
CTD-5 casts
(Blue) c/n CST-244DB
(RED) c/n CST-245DB
Sensormedics Oxygen Sensors:
O2 s/n 90222-01 sta 116
O2 s/n 6-02-07 sta 117
O2 s/n 6-02-08 on stas
114,115,118-142 (did not work during 142)
O2 s/n UNKNOWN on stas 143-203
Seabird Temperature Sensor SBE35 s/n 3516590-0011
CTD Sensor Calibrations:
CTD-3:
Pressure Sensor s/n 77011 (Paine):
P Calibs:
May
1999 - 0.09/29.88 deg.C bath to
6080/1191 db
Dec.1999
- 0.04/26.93/30.93 deg.C bath to
6080/1191/1191 db
cold cals: shifted -1.25 db from pre- to post-cruise calibration
warm cals: shifted -1.3+ db from pre- to post-cruise calibration
Correction used: pre-cruise
P calib with 0.65 offset
(in
effect, averaging the two calibs)
Temperature Sensor s/n 15778
(Rosemount PRT):
T Calibs: May 1999/June 1999/Dec.1999
(June 1999 was only a 2-point cal to re-check
Tcal)
large/~0.18 deg.C slope from 0-30 deg.C
cold end fairly similar pre- to post-cruise
warm drops ~0.015 deg.C change? (Hard to tell with steep slope)
Correction used: equally
weighted May + Dec. 1999 Tcals
(same #pts at each level, same # of levels) -
then averaged
Conductivity Sensor s/n P62 (GO): stations 116+117
Calibrated to bottle salts taken during cruise.
This sensor had a noticeable + Conductivity drift with time
during
station 116, but drifted significantly less than
the
sensor used on HNRO7 station 113.
The sensor was
"cleaned"
before station 117, resulting in a much smaller
station
117 drift. Down and up casts
needed separate
corrections,
and each station needed a different
correction
due to the sensor cleaning.
1. A second-order dC(C**2) slope based on bottle-CTD (up cast)
differences
from both casts was determined. The same
slope
was applied to both stations, to down and up casts.
2. Residual bottle-CTD (down cast) Salinity differences were
visually
grabbed from a theta-salinity plot.
A first-
order
pressure-dependent fit (dS(P)) was generated and
applied
separately for down and up casts (sta 116) and
for
the down cast only (sta 117). These
fits were applied
IN
ADDITION TO the dC(C) slope determined in step 1.
3. Station 116 deep bottles seemed to have standardization
issues
and could not be trusted. The
dS(P) fits for
sta
116 (described in step 2) were redetermined/reapplied
using
sta 117 bottle data.
4. Deep Theta-Salinity overlays of stations 114-122 were checked
for
consistency. Station 116 was at
the southeast corner
of
the "box" of stations, and station 117 was the center
of
3 casts along the eastern border of the "box".
CTD-5:
Pressure Sensor s/n 77017 (Paine):
P Calibs:
May
1999 - 0.075/29.695 deg.C bath to
6080/1191 db
Oct.1999
- 0.1/28.85 deg.C bath to
6080/1191 db
cold cal: shifted -0.35/-0.5/-0.6 db top 1000db/mid-range/4000db
from
pre- to post-cruise calibration
warm cal: shifted +0.3 top 1000db/mid-range and no change at bottom
Correction used: average
pre-/post-cruise cold and warm P calibs
(T2) Temperature Sensor s/n 17534
(Rosemount PRT):
T Calibs: May 1999/Oct.1999
+0.0007 deg.C at 0 deg.C, +0.0002 deg.C at 11
and 30 deg.C
from
pre- to post-cruise calibration
Correction used: equally
weighted May + Dec. 1999 Tcals
(same #pts at each level, same # of levels) -
then averaged
(C2) Conductivity Sensor s/n O24 (GO):
Calibrated to bottle salts taken during cruises (HNRO7+KH36 used
same sensors for this CTD, Cond. corrections determined in tandem)
1. For each cruise, generated first-order dC(C) fits with a (4,2)
std.dev.
rejection using Bottle-CTD Cond. differences outside
the
high gradient areas (used pressures < 25 db or > 200 db).
This
omitted most of the high-gradient bottle-CTD scatter.
Also,
numerous KH36 casts were omitted from these fits because
their
down-up CTD differences were more than +/-0.0015 mS/cm.
2. An average of the coefficients for HNRO7 and KH36 (from the dC(C)
fits done in step 1) was applied to both data sets, then
residual
offsets were plotted and checked.
3. Offsets seemed to slowly but steadily increase within each leg.
For
each cruise, generated and applied a first-order fit of
the
residual Conductivity offsets, using only differences
below
400db with a (4,2) std.dev. rejection.
Additionally,
a
few large bottle-CTD differences were manually omitted
from
these fits.
4. Offsets were then manually adjusted from the smoothed values
based
on deep theta-salinity consistency.
Numerous Autosal
runs
were disregarded because of standardization issues caused
by
instrument problems and operator inexperience (frequent
standard
dial changes and drifts on many stations, espec. the
first
20 stations of KH36). If the CTD
data were consistent
before
adjustment, they were generally not shifted apart merely
to
match bottle data. Some data were
shifted due to down vs.
up
cast differences (down cast CTD data are reported, but
bottles
are compared to up cast CTD data at the time of the
bottle
trips.)
5. A residual pressure-dependent slope was quite apparent at this
point. A first-order dC(P) fit was determined
for each cruise,
based
only on differences deeper than 250 db and using a (4,2)
std.dev.
rejection. (Thermocline and
surface bottles, often
also
in high gradients, distorted the fits, so only deeper
pressures
were used.)
6. The HNRO7 and KH36 dC(P) coefficients from step 5 were averaged
together,
and then applied to CTD-5 data from both cruises.
The
dC(P) and dC(C) coefficients were both used, with the
two
Conductivity offsets added together.
7. Deep Theta-Salinity overlays of 8 consecutive casts, as well
as
non-consecutive stations in close proximity to each
other
based on position and/or depth, were checked for
consistency.
B.6. Report on LADCP
observation (N. Rykov and A. Shcherbina)
B.6.1. Objectives
The
aim of observatons is to obtain a set of the
current vertical profiles from the sea surface throughout
the boltom for furher estimation of the dynamic
processes in the economic zone Russian Federation of the Japan Sea.
Objectives:
·
to make
instrumental current measurements by LADCP as to the instructions received;
·
to fulfill a preliminary data
processing by methods and sofware of University of Hawaii (USA);
·
to obtain the electronic copies of the observed
data, current vertical profile components and another characteristics, current
vectors at the given levels.
B.6.2. Characteristic of measurement equipment, methods of observations and processing
In
order to make measurements of the current
velocity and a number of associated characteristics, LADCP has been used (Lowered Acoustic Doppler
Current Profiler).Manual « DR/SC-BBADCP TECHNICAL MANUAL-AUGUST 1995 (CHANGE1)» has in it content the technical device specification,
description of control orders and parameters, list of output data format, the
basic calculation formulae mentioned in it.
The
principle of various modification LADCP operation is in a difference of frequencies for sending and
reflecting sound signal within the source and moving water mass. Measured relative current velocity is determined by the term:
V
= Fd ·C·1000 / 2Fs,
where C is a sound velocity in the sea water;
Fd -
shear of Doppler’s frequency;
Fs -
transmited source frequency. For the device used Fs =
153.6 kHz.
So
that to obtain the horizontal and vertical vector components of the
current there are used four sources sending signals
at different angle regarding each other.
The
technical characteristics of the meter take into consideration a possibility of
128 water layers echo ranging simultanuasly, each layer having thickness from
0.05 to 32 m. Given accuracy of
the current speed measurement is usually 1 sm/s. Actual accuracy depends on an
accuracy of the sound velocity determination and the time positions. In accordance with this the final data
processing requires CTD-data of
very high quality as well as the sound signal source position determination of
high discretness and accuracy in time and geographical positions.
To
countrol LADCP operation the system of commands and given parameters are used (see
below).
Specifications commands
and LADCP operation parameters.
Broadband
ADCP Version 5.52
RD
Instruments (c) 1991-96
All
rights reserved.
>CY
>RA
RA =
000 ----------------- Number of Deployments Recorded
>
>CR1
[Parameters
set to FACTORY defaults]
>PS0
Frequency: 153600 HZ
Configuration: 4 BEAM, JANUS
Match Layer: 10
Beam Angle: 30 DEGREES
Beam Pattern: CONVEX
Orientation: DOWN
Xducer Ser #: 02612
Sensor(s): HEADING TILT 1 TILT 2 TEMPERATURE
XDC Firmware: 1.16
CPU Firmware: 5.52
DEMOD #1 Ver: ad46, Type:
3
DEMOD #2 Ver: ad46, Type:
3
PWRTIMG Ver: c5d3,
Type: 4
REC Firmware: 4.05
>WV300
>WN16
>EZ0011101
>EC1500
>EX11101
>WP1
>WF1600
>WS1600
>WM1
>WB1
>WE0150
>WC056
>BP0
>CP255
>CL0
>TP
00:00:00
>TE
00:00:01.00
>TB
00:00:02.60
>TC
2
>CF11101
>CK
[Parameters
saved as USER defaults]
>B?
BA =
030 ----------------- Evaluation Amplitude Min (1-255)
BB =
0000 ---------------- Blanking (cm) (0-9999)
BC =
220 ----------------- Correlation Magnitude Min (0-255)
BD =
000 ----------------- Delay Re-Acquire (# Ensembles)
BE =
1000 ---------------- Max Error Velocity (mm/s)
BF =
00000 --------------- Depth Guess (0=Auto, 1-65535 = dm)
BG =
80,30,00030 --------- N/A Shal Xmt (%), Deep Xmt (%), Deep (dm)
BH =
190,010,004,040 ----- N/A Thresh(cnt), S Amb(cm/s), L Amb(cm/s), MinAmb
BK = 0
------------------- Layer Mode (0-Off, 1-On, 2-Lost, 3-No BT)
BL =
320,0640,0960 ------- Layer: Min
Size (dm), Near (dm), Far (dm)
BM = 5
------------------- Mode (4 = Default - Coherent, 5 = Default)
BP =
000 ----------------- Pings per Ensemble
BR = 0
------------------- Range Resolution (0 = 4%, 1 = 2%, 2 = 1%)
BS
----------------------- Clear Distance Traveled
BX =
5000 ---------------- Maximum Depth (80-9999 dm)
BZ =
005 ----------------- Coherent Ambiguity Velocity (cm/s radial)
>C?
CB =
411 ----------------- Serial Port Control (Baud; Par; Stop)
CF =
11101 --------------- Flow Ctrl (EnsCyc;PngCyc;Binry;Ser;Rec)
CG = 0
------------------- Ping Mode (0=Std, 1=Timed Data Out)
CK
----------------------- Keep Parameters as USER Defaults
CL = 0
------------------- Battery Saver Mode (0=OFF, 1=ON)
CP =
255 ----------------- Xmt Power (0=min, 255=max)
CQ =
008 ----------------- Xmt Delay Select (0-127)
CR #
--------------------- Retrieve Parameters (0 = USER, 1 = FACTORY)
CS
----------------------- Go (Start Pinging)
CT = 00
------------------ Turnkey Mode (0=OFF,1=TURNKEY)
CX = 0
------------------- Triggered Xmt (0=OFF,1=LH,2=HL,3=LH/HL,4=L,5=H)
CY =
00000000 ------------ Clear BIT Log
CZ
----------------------- Power Down BBADCP
>E?
EA =
+00000 -------------- Heading Alignment (1/100 deg)
EB =
+00000 -------------- Heading Bias (1/100 deg)
EC =
1500 ---------------- Speed Of Sound (m/s)
ED =
00000 --------------- Transducer Depth (0 - 65535 dm)
EH =
00000 --------------- Heading (1/100 deg)
EP =
+0000 --------------- Tilt 1 Sensor (1/100 deg)
ER =
+0000 --------------- Tilt 2 Sensor (1/100 deg)
ES = 35
------------------ Salinity (0-40 pp thousand)
ET =
+2500 --------------- Temperature (1/100 deg Celsius)
EX =
11101 --------------- Coord Transform (Xform:Type; Tilts; 3Bm; Map)
EZ =
0011101 ------------- Sensor Source (C;D;H;P;R;S;T)
>P?
PA
----------------------- Pre-Deployment Tests
PC ###
------------------- Built In Tests, PC 0 = Help
PD = 00
------------------ Data Stream Select (0-7)
PI =
011111 -------------- Built in Tests (Rpt;CPU;Clk;TC;DSP;Loop)
PM
----------------------- Distance Measure Facility
PS #
--------------------- Show Sys Parms (0=Xdcr,1=FLdr,2=VLdr,3=Mat,4=Seq)
PT ###
------------------- Built In Tests, PT 0 = Help
>T?
TB =
00:00:02.60 --------- Time per Burst (hrs:min:sec.sec/100)
TC =
00002 --------------- Ensembles Per Burst (0-65535)
TE =
00:00:01.00 --------- Time per Ensemble (hrs:min:sec.sec/100)
TF =
**/**/**,**:**:** --- Time of First Ping (yr/mon/day,hour:min:sec)
TP =
00:00.00 ------------ Time per Ping (min:sec.sec/100)
TS =
99/07/07,19:59:03 --- Time Set (yr/mon/day,hour:min:sec)
>W?
WA =
255 ----------------- False Target Threshold (Max) (0-255 counts)
WB = 1
------------------- Mode 1 Bandwidth Control (0=Wid,1=Med,2=Nar)
WC =
056 ----------------- Low Correlation Threshold (0-255)
WD =
111 100 000 --------- Data Out (V;C;A
PG;St;Vsum Vsum^2;#G;P0)
WE =
0150 ---------------- Error Velocity Threshold (0-5000 mm/s)
WF =
1600 ---------------- Blank After Transmit (cm)
WG =
000 ----------------- Percent Good Minimum (0-100%)
WH =
111 100 000 --------- Bm 5 Data Out (V;C;A PG;St;Vsum
Vsum^2;#G;P0)
WI = 0
------------------- Clip Data Past Bottom (0=OFF,1=ON)
WJ = 1
------------------- Rcvr Gain Select (0=Low,1=High)
WL =
000,005 ------------- Water Reference Layer: Begin Cell (0=OFF), End Cell
WM = 1
------------------- Profiling Mode (1-8)
WN =
016 ----------------- Number of depth cells (1-128)
WP =
00001 --------------- Pings per Ensemble (0-16384)
WQ = 0
------------------- Sample Ambient Sound (0=OFF,1=ON)
WS =
1600 ---------------- Depth Cell Size (cm)
WT =
0000 ---------------- Transmit Length (cm) [0 = Bin Length]
WV =
300 ----------------- Mode 1 Ambiguity Velocity (cm/s radial)
WW =
004 ----------------- Mode 1 Pings before Mode 4 Re-acquire
WX =
999 ----------------- Mode 4 Ambiguity Velocity (cm/s radial)
WZ =
010 ----------------- Modes 5 and 8 Ambiguity Velocity (cm/s radial)
>R?
RA =
000 ----------------- Number of Deployments Recorded
RB ###
------------------- Blank Check 1 MB of Recorder Memory (0 = ALL)
RD =
000 ----------------- Current Deployment Selected (0 = NONE)
RE
ErAsE ----------------- Erase Recorder
RJ
+##### ---------------- Number of Ensembles to Jump (+/- 99999)
RP =
0000 ---------------- Recorder Parameters (-;-;-;No Buffer)
RS =
000,020 ------------- Rec Space Used (MB), Free (MB), (999 = Erasing)
RT
----------------------- Recorder BIT
RY ###
------------------- Start YModem (Batch) Xfer Deployment # (0=All)
>
Parameters and commands can be used both for initial meter loading and by
an operator of LADCP. At the last
case recorrection of commands
and parameters may require
the software amendments.
The
main given parameters:
-
maximal velocity;
-
a number of ensembles of records;
-a
number of signal in ensembles;
-
time for ensemble;
-
a number of signal averaged by ensemble;
-
sound velocity;
-
type of coordinates;
-
size of memory required;
-
time of the first signal sending;
-
time interval between signals;
-
size of scanning layers;
-
a number of scanning layers;
-
accuracy of velocity measurement (root-mean-square deviation).
The
main output data:
-
reference sign indication part;
-
current velocity (each layer for each source);
-
correlation value (each layer for each source);
-
echo signal intersity (each layer for each source);
-
interest content of high quality data (aech layer for each source);
-
characteristics of the near bottom layer.
LADCP
has been built in CTD basket. Accumulator block also fixed
in CTD basket and gives feeding
to the meter. Boost charge of the battery is
produced from the vessel source of 58 V on the vessel moving. The measured data
record is performed on the autonomic information storage being located on
the device case. The obtained information is rewritten on the vessel computer of
Notebook type. The computer is controled by LADCP operator. The connected cable is used both for the commands
information transmision and as the feeding line. For the data
processing PC of Pentium class is used.
Under
the instruction an operator fulfills the
actions ensuring LADCP operation
in the regime of recording, making copies of the observed data from LADCP storage
on a hard disk PC, fills in the report of observations.
The
software for LADCP data processing
has been developed in Unviersity of Hawaii (USA). It has been prepared to use in UNIX media with a
wide applying of the languages C
and Perl and MatLab
packet. The output data presented to be processed are in a binary form. To
produce the calculations by self programm products there is a convertor to
transfer them in ASCII format.
Under
the vessel conditions the preliminary data processing has
been done. It main task is to give an assessment of the data obtained and their
suitability for future comprehensive
processing. In the preliminary the sound velocity was assumed to be constant, and the vessel drift in the observation time was to be
linear and uniform. In no way the current meter location regarding the vessel
position meter was considered. Having the great cable angle declination under
the heavy vessel drift, it could be made errors in the current calculations, especially essential at the shallow water station,
where CTD and LADCP measurements require reletavely
not much time. At the shallow water stations, in addition, the essential errors
in the current calculations can appear because of the low vessel accuracy of
GPS. The final data processing will have been produced, using CTD and navigational data during the
year at University of Hawaii.
B.6.3. Actual
program implementation; characteristic
of the obtained results
The
current measurements were fulfilled at each CTD probing. There were no any damage in the equipment
operation. The program has been carried out completely. As a result the
follouing data were obtained:
-
data of observation;
-
reports of LADCP probing;
-
GPS files (seft of satellite navigational vessel positions
determination with a discretness 3 sec);
-
plots of vertical profiles of the current components in the electronic form;
-
mapped current vectors at the levels of 60, 100 and 500 m in electronic and
hard copies.
Because of the meter constructive peculiarities and due to priviously given parameters there were not
obtained the current records at the stations of the depth less than 150 m (NN
123, 124, 128, 130, 138-141, 202, 203). In probing at ststions 131 and 132 GPS
was not working, so the measuremant positions of starting and completion are
unknown, as s result, the currents at the stations were not determined.
Because of the weather conditions the data from the stations 115-116 have very
poor quality.
The
vertical current structure of the Japan Sea region studied looks very
complex and ambiguous (Fig.6.1-6.4). As a rule, the maximal velocities were
being observed in the surface and subsurface layers preserving their direction
with in the limits of one square. Further
with the depth in the sea
different positions by individual examples there were observed the relatively
homogeneous one layer current struture, but zonal
and meridional components oftener changed their sing many times. The minimal
velocities closing to zero ones were observed in
the intermediate, deep sea or near bottom layers. In some cases the current
intensification near bottom were observed (for example, sta. 159, 163, 165, 170, 183
and so on). It is very important that the stations mentioned above were placed
in the deep sea basin. The last feature, if it finds the confirmation on the final data
processing, will require a special analysis and explanation.
In
the horizontal current structure there can be determined a number of the
circulation elements (Fig.6.5-6.7).
1. The westbern stream of the Tsushima current
propagates north-eastward to the region of
40-40.5° N, 134° E, where happens
the strengthen of it eastern component. At the depth of 60-100 m the current
velocity in the stream is to be 20-30 sm/sec. On the southern side of the
subpolar front there was observed the current intensification. At the
depth of 500 m the refurn/restore current of south-easternward
with the velocities of 5-10 sm/sec is dominant.
2. In the northen part of the region studied
in the upper layer there is observed the Japan Sea water transport in the direction of the Laperous
Strait.
3. Along the coast from 141° to 134° E the
current directed south-westward
the Primorye Current is marked. It is weak nearly the shores (3-5 sm/sec) and becomes more strong on the off shore side, where
the streams of 15-20 sm/sec branch out from it south-eastern direction.
4. In the current field two anticyclonic
eddies (A1 and A2) with the water rotation clockwise are vividly revealed. A1
eddy center is located nearly the position 41°15 N and 134° E. Near the central position the currents are
weak and instable, however, they gain in
strength up to 20-25 sm/sec at the distance of 10 miles from the center and preserve their essential ability (8-10
sm/sec) throughout the bottom (Fig. 6.8, 6.9). Moreover,
their intensification to 15-20 sm/sec is observed near bottom. All water
thickness being inrolved in the circulation by the eddy from
the sea surface throughout the bottom a new and important factor in dynamics
of the long living eddies subject to confirmation of the event by the final
result processing. On the eddy periphery the
current velocity abruptly reduces the dynamic structure of
A2-eddy (center about 40°30 N, 131° E) is more complicated if compared to A1
(Fig.6.10, 6.11). It is assymetric regarding the
central axis. Nearly the center the velocity meridional components at the intermidiate depths decreases to zero or changes it sign to opposite one. In
the upper layer the velocities excess 30-40 sm/sec and at the depths from 1500 m throughout the bottom are 10-15 sm/sec, i.e. as in the previous case the eddy rotary motions cover all the water thickness.
B.6.4. Conclusion
and summary
For
the first time the widescale survey of the Japan Sea, covering the basic current systems with instrumental
current measurement of high discretness from the sea surface throughout the bottom on the R/V «R/Revelle»
and «Prof. Khromov» has
been conducted. The data obtained for the Japan Sea are unique. The preliminary
processing results and obtained
data analysis give an evidence that they can be used for the investigations of
various dynamic processes and events.
The
main conclusions can be done as follows:
- meter
of LADCP type is an effective mean
for the water circulation and dynamics
studies. To improve its efficienty the up to data navigational vessel systems
should be fixed installed so that
to ensure the conditions of probing with the minimal deviation from the
vertical;
-
program-technology scheme of the data processing is acceptable for an operator
having experience do of PC operation, though is not quite suitable for a user of Russian Federation. It is produced
to work in UNIX media, applying languages Perl and MatLab are little known in Russia. The output data are presented in a binary form that doesn’t allow to
make their estimations by the user. The results
of preliminary processing have been presented in a graph form but not in a
table one that doesn’t allow to store them in the archive file, so that the
data to be processed and analyses further. The operator can’t change the
current measurement parameters due
to a danger not to read the data obtained and to process them. Due to the full
software absence and instruction for user it is
impossible to process data in final so that to oftain not only the graph
picture but as well as the results in a table form;
-
measured and then processed the current vector estimations are likely to be
actual both on the velocity and direction. They indicate to the current
intensification along zones of frontal divisions, along coast of the Primorie Current 48° and 43°20 N, the water
fall in the direction of the Laperouz
Strait, anticyclonic eddies at 134° and 131°30 E. Of the most
important fearture regarding the eddies mentioned
above is the participant in a circular movement not only the baroclinic layer but as well as all water
thickness from the surface throughout the bottom.
B.7. Report of hydrochemical group: P. Tishchenko
B.7.1 Objectives
The hydrochemical group’s main
task is to obtain new data on the carbonate system parameter distribution (pH
and total alkalinity), dissolved oxygen and nutrients (nitrite, nitrate,
nonorganic phosphor and silicate ) in the North-West part of the Japan Sea. In
addition, there were sampled the sea samples for dissolved calcium, inert gases
(helium, neon, argon, xenon, radon)
freons and isotopes (tritium , C14 , O18). The analysis of the samples
will be carried out in the coastal laboratories.
Besides the methodical work on pH measurements in the sea
water has been conducted. pH
measurements were produced by now general accepted spectrophotometric method
(equipment has been provided by Seoul National University) and recently worked out by POI the potentiometric
method in a cell of liquid lack unit.
The new data have been
obtained at up-to-date level so that to study the Japan water mass
hydrochemical structure in the summer season.
B.7.2 Staff of the group
and their duties.
1. Dr. P.Tishchenko, head of
group - potentiometric pH measurement, sampling (to determine pH , alkalinity,
result processing, data file formation (pH, alkalinity), report compiling.
2. R.Chichkin, researcher -
potantiometric pH measurement, sampling (to determine pH , alkalinity),
equipment preparation to measure pH.
3. J.Pavlova – chief
researcher- spectrophotometric pH measurement, sampling (to determine pH), data
file formation (pH).
4. Yu.Shulga, engineer -
spectrophotometric pH measurement,
sampling (to determine pH).
5. T.Volkova, researcher
– determination of alkalinity, equipment preparation for alkalinity
measurement.
6. E.Il’ina, researcher
– alkalinity determination.
7. Dr. A.Nedashkovsky, leading researcher - biogenic element
determination, obtained results processing , file data formation (biogenic
elements).
8.
M.Shevtzova,
engineer – biogenic element determination
9.
S.
Sagalaev, researcher- dissolved oxygen determination, sampling for oxygen, data
file formation (oxygen).
10. O.Shevtsova, researcher -
dissolved oxygen determination, sampling for oxygen.
11. A.Kalyagin, leading researcher - sampling for
helium, tritium, isotop O18.
12. O.Vereschagina, chief engineer - sampling for
freons, ampule soldering.
B.7.3 Methods of hydrochemical parameters determination.
B.7.3.1 pH – measurements
B.7.3.1.1 pH-potentiometric
determination
pH-potentiometric measurements
were being conducted just after sampling at 25°C![]() by the method of direct potentiometry in the close running
water cells of lack liquid unit
by the method of direct potentiometry in the close running
water cells of lack liquid unit
|
СЭ-Na+ |
studied section standard section |
H+-СЭ
(A) |
by glass pH – electrode
(Ross-TM Orion Co.) and Na+ - glass electrode (ESL–051-G). As a low ohm electrode there
was used chlorsilver electrode with double liquid unit (outer unit of the type “Smoothing”, model 900200, Orion Co.). EMF was recorded by digital
pH meter (model EL-940, Orion Co.)
with a sensibility of 0.1 mv. Electrode pair has been standardized by SWS
scale, using buffer TRIS as a standard (DelValls, Dickson, 1998) and pH was
calculated by the formula:
![]()
where Ex ,Es – the cell
EMF (A) in the studied standard solutions . Na molality (mNa)x was calculated by the data of salinity (S),
using terms ( Clegg and Whitfield, 1991),
![]() The rates of (gNa)х,
activity were calculated by the equation
(Tishchenko and Pavlova, 1999)
The rates of (gNa)х,
activity were calculated by the equation
(Tishchenko and Pavlova, 1999)
![]()
where I –ionic force determined by the equation
(Clegg and Whitfield, 1991)
![]() The rate of sodium activity
and molality in a standard buffer
solution were (mNa)s
= 0.44618, (gNa)s
= 0.6412, respectively.
The rate of sodium activity
and molality in a standard buffer
solution were (mNa)s
= 0.44618, (gNa)s
= 0.6412, respectively.
We made estimation of the pH
measurement error by this method and it is equal to ±0.0044 units pH (Tishchenko at
el., 1998). It total, pH was measured in 1200 samples.
B.7.3.1.2
Spectrophotometric pH determination
In the cruise the Seoul
National University suggested the equipment and reagents required for
spectrophotometric pH determination. For this method m – cresol purple-
indicator was used, constant of which depends on salinity and absolute
temperature (T) in accordance with the equation (Clayton and Byrn, 1993)
![]()
The sea light absorption was measured by an
indicator with the wave length of 434, 578 and 738 by means of
Spectrophotometer Ultraspec 2000.
pH estimations were calculate by formula
![]()
where
A - absorption at associated wave
length, ratio of function coefficients for m-cresol purple indicators are to be
![]() ,
,![]() ,
,![]() .
.
Dong-Jin Kang (SNU) stated
that the method reproductively was equal to 0.006 units pH . pH were measured
in 1150 samples by spectrophotometric method.
B.7.3.2 Alkalinity
determination
Alkalinity
has been analyzed just on sampling
by a direct titration in the open cell by Bruevich’ method (1944): 25 ml of sea
water was titrated by 0.02 n of hydrochloric acid with the mixed indicators
(methyl red and methylene blue).
In the titration process the water samples were blown through by the air free
from carbon dioxide and ammonia. The point of equivalence (pH about 5.4-5.5)
was determined by visual to transition of the light green color into light rose one. The titr HCl was
installed daily in accordance with a standard soda solution prepared by the
weigh method taking into consideration the vacuum amendment as to Dickson’s
CRM. Titration was produced by a burette of Brinkman/Dosimate –665.
Reproduction of sample obtained at one level was ±0.0027 mg-equ/l.
B.7.3.3 Determination of
biogenic elements
Out
of the biognic elements NO2 and NO3 nonorganic phosphor and silicon solved in
the water were determined. The samples were analyses by standard
spectrophotometric method. In the analysis there was used autoanalizator
“Technicon”, provided by SIO. The method accuracy is 1%. At 85 station 1500 sea
water samples were measured.
B.7.3.4 Oxygen
determination
Dissolved
oxygen determination was produced by the volume Vinkler’s method, modificated
by Carpenter (1965). The essence
of modification is in the fact that the end point of titration was determined
by photocolourimetry (350-365 nm) with further processing by a computer, i.e.
the titration process happened without a man activity that allowed to increase
the method accuracy and its reproduction. Usage of precession weighers also promoted to increasing of the
accuracy method. The authors of
the method state that the dissolved oxygen in the water is determined with the
accuracy of ±0,005 ml/l.
The
equipment used was from (Scripps Institute of Oceanography), and consisted of
microburettes
Brikman/Dosimate-665, photocolourimeter and PC286/20/40M. The injectors of 1 ml were used in the
burettes for oxygen titration and by 10 ml for calibration of thiosulphate
solution. The burette control for titration taking photocolourimeter records as
well as burette and temperature detectors (temperature Na2S2O3 and KIO3) were
carried out by computer through multichannel chart I/O (PCL-812) and the
readable terminal. The software for work of SIO installation was written on
Beisik (qb45). The oxygen bottles used of standard SiO, also calibrated there. The reagents and standards
provided by SIO were used for the work.
B.7.3.5 Calcium
determination
Calcium
will be analyses by a complexonometric titration EGTA (Tsunogai S., et al.,
1968). The essence of the method is as follows: 10 g of the sea water is
transferred into 100 ml conic flask there EGTA solution of 7.5 mm volume was
added that made titration of 95% for initial calcium quantity. After mixing by
magnetic mixed device in the flask was introduced 2 ml of 0.05% GHA
[glyoxal-bis (2-hydroxy-anil)] and 2 ml of borate buffer solution. The obtained
solution were mixed during 3 minutes and 4 ml n-butanole was added that extragated in red
calcium GHA complex in a thin organic layer. Further calcium titration is being
produce by the intensive mixing to colour an organic layer colour transition from red to
colourless . The standard solution is being prepared from calcium oxide sample
preliminary calcinated at 950°C , soluted
in the hydrochloric acid. Correction factor considering strontium
presence is equal to 0.9946 (Tsunogai S., et al., 1968). Applying of
Brikman/Dosimat-665 burette with 0.001 ml scale division provided the analysis
accuracy of ±0.1%.
B.7.3.6 Dissolved gases
The
dissolved gases – freon, helium and the other noble gases (neon, argon,
xenon, radon) serve as indicators of the water mass age. The samples to analyze
freons were taken at 43 stations (601 samples) and will be transferred in
Washington University (Seattle, USA). The samples on helium and other inert
gases (37 stations, 325 samples) as well as on isotopes O18 (40 stations, 325
samples), tritium (34 stations, 278 samples) were taken for transferring them
to be analyzed in Kyung-Ryul Kim’s laboratories (Seoul University) and Bill
Jenkins (Institute of Oceanographic Sciences, Southampton, England).
B.7.4 Work carried out
and form of the results to be presented
In
the cruise pH and alkalinity were measured at 100 stations, oxygen and biogenic
elements were determined at 102 stations. For the surface level at 100 stations there were obtained the
samples with the solved calcium content, in addition, the samples were taken at
a few deep-sea stations.
The
measurements were fulfilled in the cruise are as follows :
pH pot 1200
pH spec
1200
Alkalinity
1200
Oxygen
1650
Nitrite
1650
Nitrate
1650
Nonorganic phosphor
1650
Nonorganic silicon
1650
Calcium
300
pH
estimations were measured within SWS scale and presented in total file KH36.sea
. Determination results of oxygen, alkalinity, biogenic elements are also given
in this file.
B.7.5 Preliminary
scientific results
B.7.5.1 Comparison of
potentiometric and spectrophotometric methods of pH measurements in the sea
water
At
the initial test cruise stage we used the methodical variant of
spectrophotometric pH measurement suggested by SNU. It included the sea water
passing transport through the running that was destined to determine the
accurate volume of the sample introduced in the optical cell. In this case the
sea water sample was being mixed with the indicator by means of the air bubble
being in the cell. Fig. 7.1a shows the result difference between potentiometric
and spectrophotometric measurements this difference is to be – 0.025
units pH. In a few case it reaches – 0.1 units pH. We suggest that this
difference should be due to the carbon acid lost in the process of the sea
water sample going from a bottle in to the spectrophotometric cell. To make
spectrophotometric pH measurements is not required the accurate ration between
the indicator and sample. In order to reduce the sample way passing, a pipette
was removed. Actually the agreement of the methods were improved, but general
picture staged similar (Fig. 7.1.b). We explain this by a degazation in the
mixing process of the indicator and sea water by means of the air bubble. To
avoid this effect all gas bubbles were removed from the spectrophotometric
cell. As a mixer of the sample and indicator a piece of ftoropeast was used. It was a case of maximal
agreement between 2 methods (Fig. 7.1c). However as before the systematic
difference (-0.15 units pH) is presence between 2 methods. Perhaps it is due to
different standards used by two methods. (The potentiometric method was used
TRIS buffer and spectrophotometric one was used the constants of indicator).
However, we think that in the spectrophotomentric method we were not able to
exclude the degazation process, therefore the results of the potentiometric
method are considered to be move correct. So in further work only these results
will be used by us.
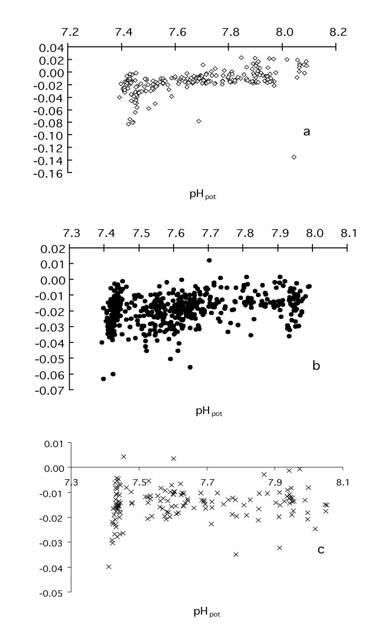
Fig.7.1. Difference of potentiometric
and spectrophotometric methods for pH measurement; a - running pipette is used for spectrophotometric
method; b - pHspec were obtained not using the running
pipette; c –indicator and sample
were mixed without air bubbles.
B.7.5.2. Carbonate
system and oxygen
Generally known, that the
surface water, as s rule, is close by its saturation to the gases as oxygen and
carbon dioxide. These gases distribution is close related between them through
the organic matter, that is form and broken down in the sea. If assumed
Redfild’ stoichiometry for the organic matter, them the relation between the
important gases will be written by the below equation
(CH2O)106(NH3)16H3PO4+138O2=106CO2+122H2O+16HNO3+H3PO4
In this case when the reaction
goes from the right to the left (photosynthesis) the surface water can be under
saturation by the carbonic and over saturation in relation to oxygen. However,
this process may be only in the field of photical layer. This layer below, the
process of the organic matter oxygenation only occur (reaction is from the left
to right). As a result, the deep sea waters are always under saturated by
oxygen and over saturated by the carbonic acid. Due to these reactions and gas
exchange on the boundary – sea water/atmosphere, the sea water is
essentially stratified with the depth regarding concentration of oxygen and
carbonic dioxide. In this case, if the rapid dynamic processes (for example
eddies) lead to the water mass vertical transport, then the oxygen and carbonic
dioxide content may serve as the indicator of the processes mentioned.
pH was measured in the cruise.
This value, above all, depends on the carbonic acid concentration. Total
alkalinity was also analyzed by us. The estimation of two parameters of
carbonic system will allow us to calculate the other ones, including the
carbonic acid concentration. However, here we’ll only consider quality and
character of distribution for the directly measured data.
Fig. 7.2. shows oxygen and pH
distribution. The figure demonstrates that in pH and oxygen distribution is
observed a slightly expressed minimum at the depths of 1500 – 2000 m. The position
scattering on the profile vividly increases the analytical errors for the levels
upper 1500 m. Distribution becomes more homogeneous at the deeper levels. In
this case oxygen changes within the limits 210 – 212 mcmol/kg, leaving an
average value 211 mcmol/kg. pH
estimations are within
the limits 7.41 – 7.44, an average value is equal to 7.425 that is lower
to some extent for the average meanings (7.446) at the deep sea levels obtained
in the winter period (Tishchenko and et al, 1998b).
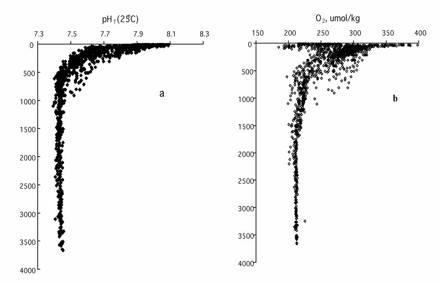
Fig.7.2. Profiles of pH (a) and oxygen (b).
The figure shows the
close character of pH and oxygen distribution that indicates to their internal
relation.
As
already told pH is to an essential degree, determined by the carbonic acid
concentration and the latter is related to oxygen through the reaction above mentioned. Fig.7.3 shows directly
correlation relation between pH and oxygen. In spite of the evident dependence (nearly to linear
one) of these parameters, there exist the ejection areas in the pH increasing .
We consider these injection are chemical processes but not analytical
measurement errors that should be carefully studies and guessed. Fig. 7.4 gives the results of
alkalinity measurements.
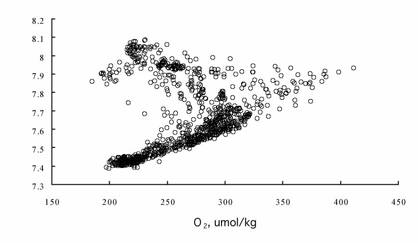
Fig. 7.3. Correlation field of pH-oxygen.
The
surface levels are as a rule characterized by the lower estimations of
alkalinity (Fig. 7.4a). This factor is due to an effect of dilution, i.e. by
lower salinity. By normalization of alkalinity to 35o/oo salinity the effect of
dilution is removal (Fig. 7.4b). Minimum of alkalinity normalized at the depth
of 200 – 300 m seems to be explained by zooplankton consumption of
carbonate calcium. The normalized alkalinity is little changed with the depth. Its average value is
2.350 mg-equ/kg lower 2000 m that
is well associated to the value 2.355 mg-equ/kg prior obtained by us
(Tishchenko at et., 1988b).
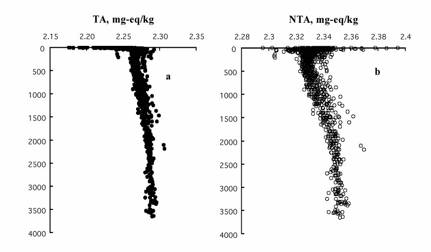
Fig.7.4.
Profile of alkalinity
distribution (a) and
normalized alkalinity (b).
B.7.6
Biogenic element variability at the deep-sea stations
Fig.
7.5 gives the general character of vertical silicate and phosphate variability.
The vertical nitrate variability is similar to phosphate one that is confirmed
by Fig. 7.6 where nitrate –
phosphate correlation fields are shown.
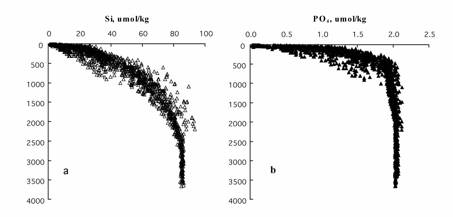
Fig. 7.5. Correlation fields silicates-depth (а) and phosphates-depth (b)
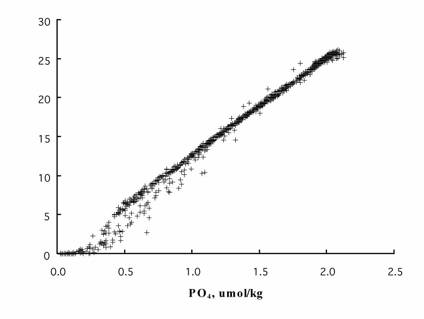
Fig. 7.6. Correlation field nitrates-phosphates (DN/DP
= 13.1, r = 0.995)
The obtained data
show that at the deep sea stations the vertical biogenic element distribution
can be characterized by the three layer structure :a) homogeneous deep sea
layer (from 2000 m to the bottom), b) intermediate layer(100-500),c) surface
layer.
B.7.7
References
Bruevich S.V. 1944. Alkalinity definition
in small volume of sea water by direct titration. // Manual on chemical
investigations. Edit. «Glavsevmorput’», 83 pp.
Tischenko P.Ya., Bychkov A.S., Pavlova
G.Yu., Chichkin R.V. 1998a. Standardization of pH measurements on method Pitser
basis. // Physical chemistry, Vol. 77, #6, p.1049-1058.
Tischenko P.Ya., Pavlova G.Yu., Salyuk
A.N., Bychkov A.S. 1998b. Carbonic system and dissolved oxygen of the Japan
Sea. // Oceanology, Vol. 38, #5, p.678-684.
Clegg S.L., M.Whitfield, in Activity
coefficients in electrolyte solutions. 2nd Edition/ K.S.Pitzer Ed., CRC
Press, Roca Raton, Ann Arbor, Boston, London, 1991. p.279-434.
DelValls
T.A., Dickson A.G. 1998. The pH of buffers based on 2-amino-2hydroxymethyl-1,3-propanediol
(‘tris’) in snthetic sea water// Deep-Sea Res.I, V.45, p.1541-1554.
Tsunogai S.,
Niskimura M., Nakaya S. 1968. Complexometric titration of calcium in the presence
of larger amounts of magnesium// Talanta, V.15, p.385-390.
Tishchenko P.Ya., Pavlova G.Yu. 1999. Standardization
pH Measurements of Seawater by Pitzer’s
Method. In: CO2 in
the Oceans, Tsukuba.
B.8. Report of bioptical group:
S. Zakharkov
B.8.1.
Basic scientific positions
The main investigations have
been carried out by Dr. S. Zakharkov (POI) with a help of Dr. G. Mitchell
(Scripps Institute of Oceanography).
Spectors of the surface water
reflection and direct sunlight were measured by a and radiometer SIMBAD. The
above water measurements were supported by the water samples to determine
chlorophile "a", HPLC-pigments, absorption
particles and dissolved matters, particles
of organic carbon
and nonorganic material.
The samples were taken in
euphotic zone defined by the depth of Secchi disk. The particle matter was
divided into phytoplankton and detrit
components using methanol extraction and differential spectroscopy. The summary
particle absorption and water solution can be used to model
the coefficients of spector rejection weaken in the euphotic zone.
The rejection light
coefficients and CTD data will be used to determine the water mass structure
and circulation. Meters of the red and blue spector rejection were built in CTD
system of SIO. The water samples throughout
the depth were taken at individual stations for the analyses mentioned above to be done. The coefficients of
rejection will be related to the vertical hydrological and hydrochemical
structure parameters, including oxygen, biogenic elements,
salinity and temperature.
B.8.2. Equipment, provisions and reagents used
Under water trausparence meter (in red spector field).
Under water transparence meter (in blue spector field).
Spectrophotometer Cary 1E UV/Visible (190-900 nm).
Universal small oceanic meter light reflector SIMBAD.
PC ATC 386.
PC HTI P-90 MHz.
Colour monitor SVGA Shamrock 15.
Dewar flask of 5 l liquid nitrogen Taylor Wraton.
Dewar flask of 35 l liquid nitrogen Taylor Wraton.
Vacuum filtration equipment including 2 vacuum pumps, filtration
reservoir, orgglass installation for the sample filtration, filtering funnels,
forceps and so on.
So that the above described work to be carried
out on board the "Pr. Khromov" were delivered 8 l of methanol (for
pigment extraction), 100 ml of 25% glutaric
dialdehyde, 4 l of ethanol (to wash glasses and optical windows), 1 l of
concentrated hydrochlorid acid (to wash the flasks for samples). The
liquid nitrogen (35 l) was received in Pusan.
B.8.3.The
group staff
The group consisted of Dr. S.Zakharkov
(POI)
B.8.4.
Methods
B.8.4.1.
Typical plan of station
Above water reflection was measured by
SIMBAD in the day light of CTD stations. The water samples from CTD-ROSET
system were taken from the surface
and at the chosen depths, day stations to provide SeaWiFS and SIMBAD
with the data. The analysis of one sample part for absorption was done on the
vessel the other samples are kept in liquid nitrogen so that further to be analysed in SIO, in
case of nitrogen is not much the samples will be put in the scientific freezer. The samples for mineral optics were fixed by the glutaric
dialdehyde on the glass flasks and sent to SIO.
B.8.4.2. Water sampling
At two stations in day time from the sea
surface will be sampled 10-15 l of water for detailed
analysis. At the other depths taking into
account the works
to be fulfilled and the particle concentration in the water there will be
sampled 5-10 l of water. To carry out this work it may take two bottles as a
maximum.
Table shows a maximal number of the levels
where the couple water sample to the samples to
be taken.
--------------------------------------------------------------------------
Stations of depth less
Maximal number of the levels
than 500 m
6
500-1500
4
1500-2000
3
2000-2500
2
more
than 2500 1
The sample bottle water for hydrooptical
studies were chosen on all other hydrological and
hydrochemical samples completion.
B.8.5.
Results
The light rejection paramerters in
the Japan Sea were studied including the specific
chlorophil absorption. The coefficients of chlorophile including the specific
absorption. The coefficients of chlorophile specific absorption can be used to
establish the photosynthetic models of the studied region
productivity. To obtain the aim the water samples taken on the euphotic zone to
be measured. Besides, the samples to analyse the other
phytoplankton components to be chosen.
In a total to be sampled
a) 192 samples to analyse the particle and detritus absorption spectors at 36 stations; 44 out of the samples being analysed in the
cruise, the other ones to be sent for the analysis in SIO;
b) 44 samples to analyse the dissolved matter
absorption spector. All were
analysed on board the vessel in the cruise;
c) 141 samples at 33 stations to analyse the organic
carbon particles;
d) 92 samples to analyse phicoeritrine at 27 stations;
e) 118 samples to analyse phytoplankton pigments by
the method of a high efficiency of liquid
chromatography at 27 stations;
f) 80 samples to analyse aminoacids of micospirine
types (photoprotectors of phytoplankton) by the method of liquid chromatography
high efficienly at 27 stations;
g) 191 samples at 36 stations to determine chlorophile
"a" concentration by the fluorescentic method;
h) 48 samples to analyse mineral optics at 8 stations.
The water transparence is also measured by
Secchi disk at 29 stations and reflected light polarization spector measurement
by hand Simbad at 31 stations were produced.
B.8.6
Conclusions
1) For the first time the large scale
survy of the Japan Sea studied to be carried out by the
up-to-date methods. On further result processing in the coastal laboratories
the models describing the level of the initial organic production in the Japan
Sea will be constructed.
2) The investigations carried out, will be
used for SeaWeaFS data calibration.
3) During the studies conducted in all the
regions there were observed the summer minimum in
phytoplankton evolution that was due
to high transparence by Sekki disk and low phytoplankton pigment
concentration.
B.9. Synoptic eddies study over the North-West part of the Japan Sea:
V. Ponomarev
B.9.1
Experiment aim
The aim of this expedition
program is to determine the anticyclonic eddy structure over the NW part of the
Japan Sea on the background of large scale oceanographic survey being produced
within the basic program. It’s supposed to make assessment of the eddy effect
on the hydrological and hydrochemical feature distribution in the intermediate,
deep-sea and near bottom sea layers. In future, the obtained data can be used
to make assessment of the vertical transport and heat, salt and chemical makers
inflow in the deep sea layers.
B.9.2 Hypothesis being put in the background of
experiment
In the cruise on the R/V
«P.Gordienko» in April 1999 firstly there were obtained the hydrological and
chemical feature distribution in three anticyclonic eddies over the Japan
trough northward the subarctic (Polar) front. It was demonstrated that:
- the horizontal dimensions of these eddies decrease with the basic
pycnocline thickness under the theoretic estimations,
- the vertical anticyclonic eddy scale is essentially more than the
main pycnocline thickness and the eddy effect propagates to the depths of
2000-2500 m,
- in the anticyclonic eddies core of the NW part of the Japan Sea,
the most warm and the freshest waters are located in compare to the
surrounding ones corresponding to the vertical salinity and temperature
stratification in the given sea part,
- the anticyclonic eddies located southward the subarctic front have
waters of increase salinity and temperature estimations in a core as to
the subtropical vertical water structure in this part of the sea.
By the virtue of the essential
number and long evolution of anticyclonic eddy formation their effect on the
vertical transport of heat, salt, dissolved oxygen and nutrients of the Japan
Sea can be essentially great.
Estimations of climatic
changes in the Japan Sea fulfilled by PIO (Ponomarev, Salyuk, Bychkov 1996,
Ponomarev, Salyuk 1997), Hokkaido University (Minobe 1996, 1997), Washington
University (Riser 1997) and Seoul National University (Kim K.-R., Kim K. 1998)
showed that on recently 20-30 years the Japan Sea deep layer winter ventilation
decreased essentially. With this factor, the deep sea water temperature and
their content of silicates increase and salinity and dissolved oxygen content
decrease. In the upper layers of the Japan Sea proper waters (250-1000 m) the
potential temperature more increases with time if compared to the lower waters.
The vertical density stratification and thickness of the main pycnocline
therefore also increases and the barocline effects, on the whole, for all over
the sea strengthen.
On our opinion, when there
lacks the deep water exchange through the Straits that is a character of the
Japan Sea, the eddies of synoptic scale are one of the important physical
mechanism causing the vertical heat flowing in the deep sea layers. If a number
of the cold winters decreases as well as the deep water cooling due to the
convective processes, including the slope convection and convection in eddies,
the positive heat flowing seem to be dominated, caused by synoptic eddy
dynamics, and potential proper sea water temperature increases from year to
year. The hypothesis mentioned is the basis of the experiment planned to study
the synoptic eddies.
B.9.3 Preconditions to choose the region of studies
Elements of the synoptic scale
dynamics over the Japan Sea (anticyclonic and cyclonic eddies, warm and cold
stream intrusions (streamers), meanders, rings, boundary currents, and
upwelling structures) are well presented in the satellite pictures of high
resolution within the infrared and radiolocational ranges. The most long living
and stable elements of the synoptic dynamics are the anticyclonic eddies having
here less spatial scales if compared to the ocean - 30-80 km. These eddies are
well seen in the satellite pictures in the cold half of year due to temperature
contrast. Therefore, their dimension, velocity of moving can be estimated, the
individual eddy transport trajectory can be observed.
In April 1999, the joint
cruise with POI and FERHRI on the R/V «P.Gordienko» was carried out, so that to
define the peculiarities of the hydrological conditions in the South-West part
of the Japan trough in the spring season. The task has been set, in addition,
to determine the thermohaline characteristics of three anticyclonic eddies
observed in the satellite pictures of the region studied.
In the cruise on the R/V
«Prof.Khromov» in the second time the hydrometeorological sections were
produced across of two eddies with a resolution to 7 miles. Taking into
consideration the fact that the sections through eddies are directly connected
with the large scale sections carried out by the main program of the Japan Sea
survey.
B.9.4 The main objectives of the experiment
· to determine a distribution of
hydrological (temperature, salinity, density, current velocities) and
hydrochemical (content of oxygen, nutrients, pH and so on) features in two
typical anticyclonic eddies of the North-West part of the Japan Sea in the
middle of the summer season,
· to reveal the eddy structure
variability occurred from April till August 1999
·
B.9.5 Expected methods of antyciclonic eddies
studied
It’s suggested to fulfill the
oceanographic sections with horizontal resolution of 7-10 miles , that are to
cross two antyciclonic eddies in zonal and meridional directions. The eddy
positions are preliminary defined by satellite pictures available and clarified
in process of section producing. At each station of the meridional section
crossing the eddy, there is a depth of specific isotherms location (5°, 2°, 1°, 0.75°, 0.5°) by the distribution of which the most probable eddy
center position is determined, as well as latitude of the further zonal section
across the eddy. Respectively, the oceanographic stations location on zonal
section also clarified. The levels, where samples are taken, are chosen as
CTD-probing happens. Sea water sampling is produced in a specific points of the
temperature, salinity and oxygen content profiles by CTD-probing. Sampling
vertical resolution from the upper layers to the lower ones decreases.
The additional observations
and data taken in investigation results to be analysed:
1). The vessel meteorological observations on the
vessel way and at oceanographic stations with a help of MIDAS are produced. In
the period of the section fulfillment crossing the eddies, the meteorological
observations are made at the interval of 2 minutes. Recording of meteorological
data on magnetic carriers, the slip averaging at 10 minute window is carried
out.
2). Standard visual observations on the cloudiness,
sea surface state in the vessel meteorological terms are made. Besides,
availability of the slick bands on sea surface and their orientation to the
vessel running in area of anticyclonic eddies are fulfilled in a visual way.
In perspective it’s supposed
to carry out detailed analysis of the data observed in anticyclonic eddies
using temperature, salinity (CTD), current velocities (ADCP), content of oxygen
and nutrients.
B.9.6 Preliminary scientific results
By satellite pictures and CTD
probing the anticyclonic eddies on the investigation migrated (from April till
August 1999) by 15-20 miles, mainly, eastward. Along with, center of the first
east eddy has the northward shifting, but center of the second west eddy has
the southward one. The eddy center positions changes marked, are in
correspondence with their general migration over the Japan basin slopes against
the clockwise that has prior shown in Lobanov, Danchenkov, Nikitin, 1998.
Figures 9.1-9.10 show
sistribution of temperature, salinity, density and oxygen on individual
sections crossing the anticyclonic eddies. These distributions demonstrate the
preliminary research results that are formulated as the following conclusions
and summary.
The thermohaline structure
changes of two studied anticyclonic eddies occurred during four months
(April-August 1999) are essential, mainly, in the upper layer with thickness of
100 m in accordance with annual variation of hydrological conditions.
In the cold period the minimal
vertical temperature, salinity and density gradients were marked in the central
eddy part in near surface layer with a thickness of 100-150 m.
In the warm period the minimal
vertical gradients of the features marked are observed below the seasonal
pycnocline having the curvature of opposite sign as compared to the curvature
of the main pycnocline. The eddy core has a form of the infrathermocline lens
where are involved in the less salinity surface waters from the eddy periphery
(fig. 9.5) in a form of stream intrusion from the north-west. On the core
periphery in the main pycnocline as on the sea surface there are observed
stream intrusion of the salt subtropical waters from the south (fig. 9.2).
The evident changes in
thermohaline eddy structure below the levels of 170-200 m were not discovered.
Differences of the north-east (eddy 1) and south-west (eddy 2) eddies are
almost the same as were observed in April 1999.
The south-west eddy has more
horizontal (to 120 km) and vertical (to 2000-2500 m) scales if compared to the
north-east eddy (fig. 9.1-9.6). It’s characterized by more contrasts in
salinity distribution of the main pycnocline, has more fresh and warm waters in
core, more asymmetry and axis inclination than the north-east eddy.
On the whole, by the
preliminary estimations of the horizontal gradients for the potential
temperature and salinity in the lower deep sea and near bottom Japan basin layer
(deeper 2000 m) the effect, at the least, of the south-west eddy to the
temperature and salinity distribution has place almost to the basin bottom. The
temperature, salinity (CTD), current velocities (ADCP) data showed that the
anticyclonic eddy dynamics is interrelated to the large and synoptic scale
circulation being under influence of the bottom topography in the deep sea and
near bottom Japan basin layers.
B.9.7
References
Kim K.-R., Kim K. (1997) What
is happening in the East Sea (Japan Sea): Recent chemical observations during
CREAMS 93-96. J. Korean Soc. Oceanogr., 31, p.163-170.
Lobanjv V.B., Danchenkov M.A.,
Nikitin A.A. (1998) On the role of mesoscale eddies in the Japan Sea water mass
transport and modification. Oceanography, Vol. 11, No 2, Supplement, p.46.
Minobe S. (1996) Interdecadal
temperature variation of deep water in the Japan Sea (East Sea). Proc. Fourth
Workshop CREAMS, Vladivostok, February 12-13, 1996, p.81-88.
Minobe S. (1997) Climatic
variability with periodicy of 50-70 years over the North Pacific and North
America. Proc. CREAMS’97 Int. Symp., Jan. 26-31, 1997, Fukuoka, Japan,
p.149-152.
Ponomarev V.I., Salyuk A.N.,
Bychkov A.S. (1996) The Japan Sea water variability and ventilation processes.
Proc. Fourth Workshop CREAMS, Vladivostok, Feb. 12-13, 1996, p.63-69.
Ponomarev V.I., Salyuk A.N.
(1997) The climate regime shifts and heat accumulation in the Sea of Japan.
Proc. CREAMS’97 Int. Symp., Jan. 26-31, 1997, Fukuoka, Japan, p.157-161.
Riser S.C. (1997) Long-term
variations in the deep ventilation of the Japan/East Sea. Proc. CREAMS’97 Int.
Symp., Jan. 26-31, 1997, Fukuoka, Japan, p.31-34.
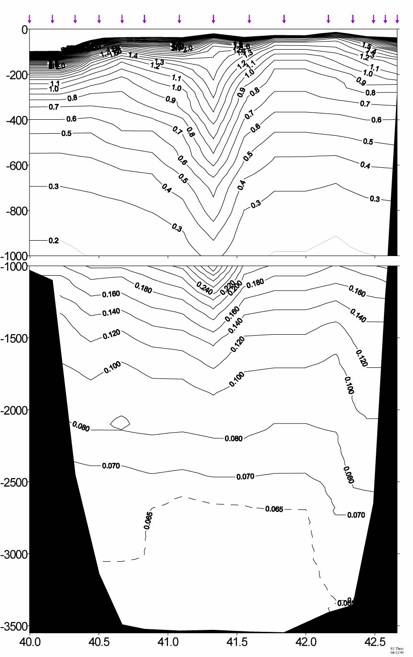
Fig. 9.1. Distribution of potential temperature on the
section along 134°E, crossing the anticyclonic eddy
1, stations 157-178.
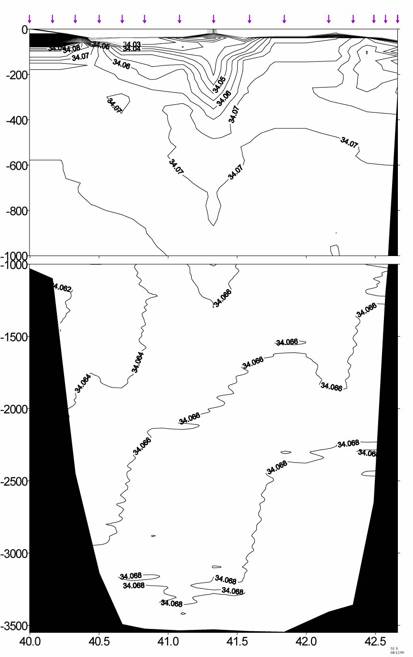
Fig. 9.2. Salinity distribution on the section along 134°E , crossing the anticyclonic eddy 1, stations 157-178.
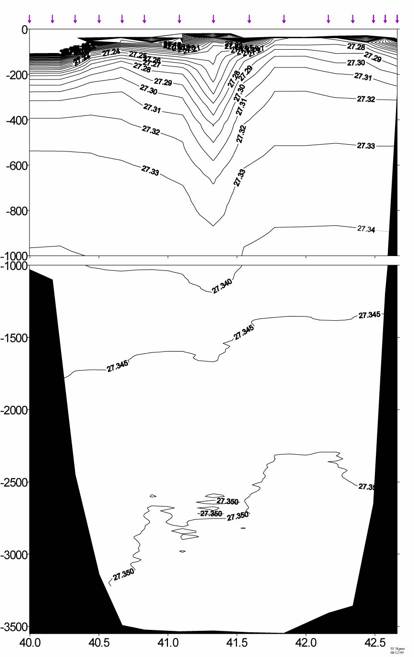
Fig. 9.3. Distribution of potential density on the
section along 134°E, crossing the anticyclonic eddy
1, stations 157-178.
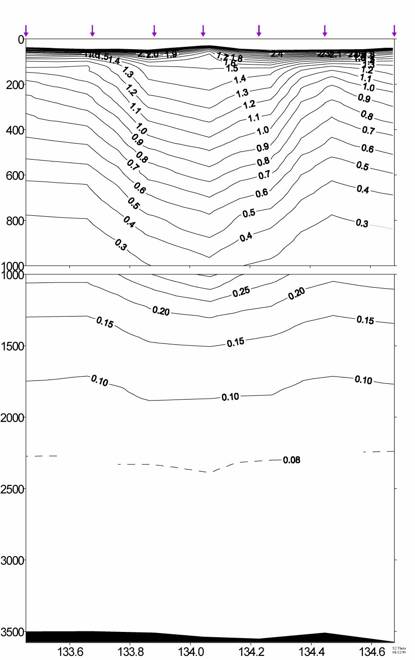
Fig. 9.4. Distribution of potential temperature on the section along 41°15'N, crossing the anticyclonic eddy
1, stations 166-172.
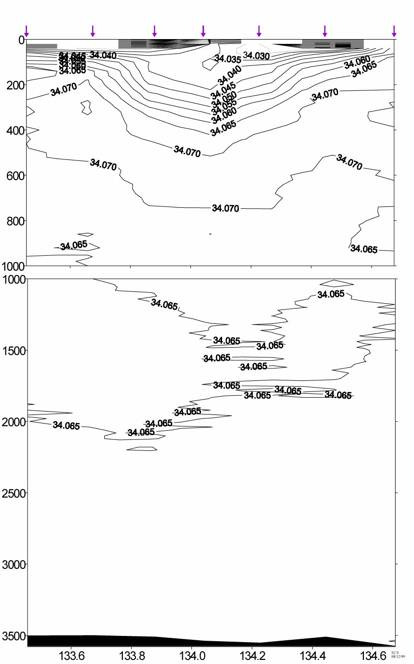
Fig. 9.5. Salinity distribution on the
section along 41°15'N, crossing the anticyclonic eddy
1, stations 166-172.
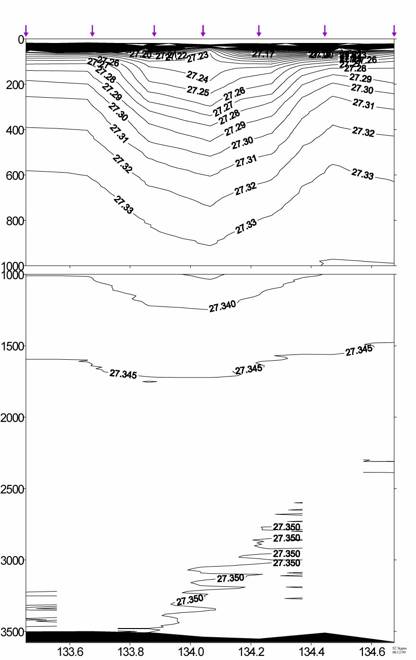
Fig. 9.6. Distribution of potential density on the
section along 41°15'N, crossing the anticyclonic eddy 1, stations 166-172.
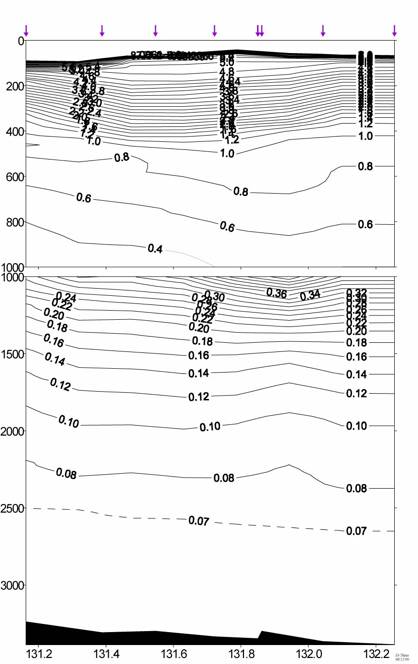
Fig. 9.7. Distribution of potential temperature on the section along 40°45'N, crossing the anticyclonic eddy
2, stations
188-194.
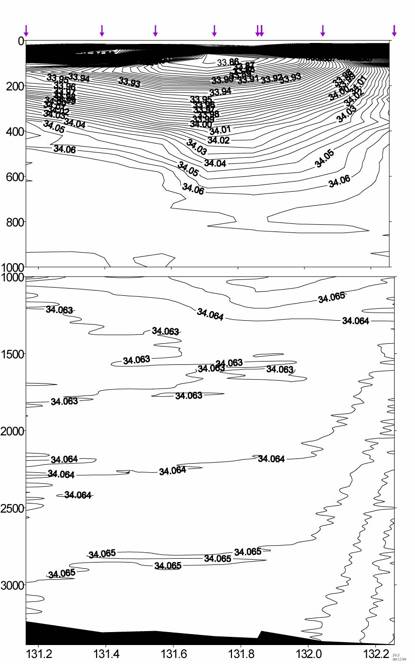
Fig. 9.8. Salinity distribution on the section along 40°45'N, crossing the anticyclonic eddy 2, stations
188-194.
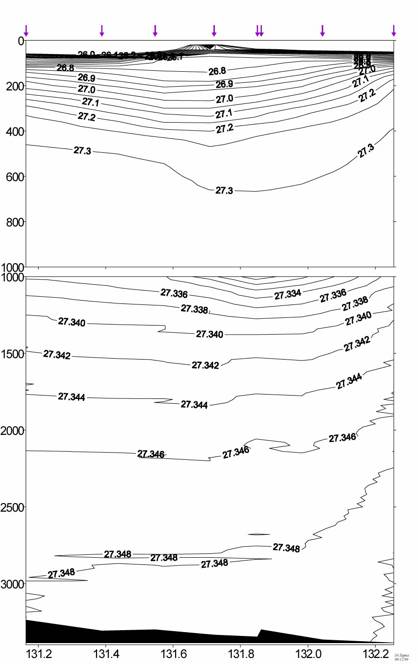
Fig. 9.9. Distribution of potential density on the
section along 40°45'N, crossing the anticyclonic eddy 2, stations 188-194.
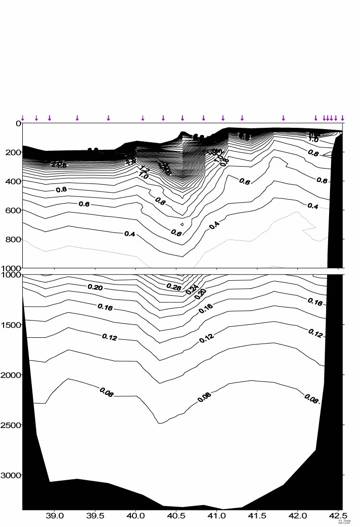
Fig. 9.10. Distribution of potential temperature on the section along 131°30'E, crossing eddy 2, stations179-203.
Appendix A: CTD data quality comments (M.
Johnson, SIO/ODF)
## KH36 notes:
162/01 hit bottom; truncated pseq data before
hit
175/01 hit bottom; truncated pseq data before
hit
176/01 digitized data
start in-water, +1db added to pressure values for entire
cast (compared raw pressure/temperature values at surface to nearby
casts)
## Pressure levels
interpolated (missing data, or omitted instabilities at surface):
116/01
0,30,34 db
117/01
0 db
118/01
34 db
120/01
18-20 db
145/01
540 db*
91 casts/8 levels interpolated
*145/01 cast restarted
shipboard; 464-638db data are missing in
shipboard-digitized raw CTD data
file. Recovered most
by redigitizing missing area from vhs
tape and cleaning
up extremely high noise levels.
## winch stops/yoyos on
down casts (not at surface or bottom of cast):
114/02 1.5 mins. at 42 -
52 db ##
maxp 1068
120/01 1.5 mins. at 1936
- 1942 db ## maxp 1976
151/01 3 mins. at 1960 -
1964 db ## maxp
3186
155/01 4 mins. at 722 -
728 db ##
maxp 3652
161/01 43 mins. at 1860
- 1864 db ## maxp 3414
also, 14 db yoyo here (1862 back to 1848 db down)
172/01 11 mins. at 3366
- 3372 db ## maxp 3504
## Conductivity offsets: OC = Offset Conductivity OS = Offset Salinity
(all these casts are deeper than
3000db)
153/01 788-822 db #OS/+0.145 to +0.215 PSU
154/01 558-564 db #OS/+0.26 to +0.44 PSU
166/01 720-914 db #OC +0.003 mS/cm
183/01 1428-1442 db #OS/+0.013 to +0.086 PSU
184/01 1116-1128 db #OC +0.004 mS/cm
190/03 1226-1230 db #OC +0.001 mS/cm
190/03 1228-1300 db #OC +0.005 mS/cm
Appendix B: Bottle data quality comments
Bottle data quality
comments
Japan East Sea
Summer 1999
Khromov KH36
Contact: Lynne D. Talley ltalley@ucsd.edu
6/24/02
For salinity: batch P134
was used on kh36, kh38 and xp00
----
kh36 quality comments -
console log sheets, sample log sheets,
bottle sample log book,
salt, oxigen, nutrients analysis logs.
Codes:
qflg = 4 bad value
qflg = 3 suspicious value
qflg = 2 good value
Leg 1 (test cruise):
Station 114 02
CTD 5, big Rosette
Cast 01 - winch stop on way
down. Wire problem.
Cast 02 - some double
samples for optics. Duplicates delete
from H00.
Save in H00.svd.
DLOG - 205 SiO3 too low
(qflg = 3)
207 sal - low (qflg = 3)
Station 115 01
CTD 5, big Rosette, bad
weather, rolling, deck overflow during station.
SLOG - Bottle 15 - stopcock
pushed hardly.
DLOG - 101 PO4 high,
probably OK (qflg = 2)
Station 116 01
Too rough for work with big
Rosette. Wind 15 m/c.
CTD 3, small Rosette.
Some double samples for
optics. Duplicates delete
from H00. Save in H00.svd.
CTD salinity spikes in
strong T gradient.
SLOG - Bottle N9 broke
spigot boarding, no samples.
Station N 116 01 used twice in
computer.
Bottles NN 2, 14, 9 - leak
prior to venting
(when stopcock pushed in and
vent closed).
DLOG - 101 not enough water
for salt, nuts.
102 not enough water for oxy.
Salt missing.
109 not enough water for salt,
nuts, oxy.
114 not enough water for salt,
nuts, oxy.
102 bad salt, nuts.
104 bad all salt, nuts, oxy
(qflg = 4)
Edited H00 file - bottle 4
delete. Save values in H00.svd
bottle 2 deleted. Save values in H00.svd.
Station 117 01
CTD 3, small Rosette.
CTD salinity spikes in
strong T gradient.
SLOG - Bottles NN 4,5,11,14
- leak prior to venting.
DLOG - 111 no sample for
oxy.
102 SiO3 hight (qflg = 3).
101 -salt too hight. No flush
between std and sample 1 (qflg = 4).
Change value on -9.0 in H00.
Save value in H00.svd.
Autosal - check end worm std.
Use 1.99984 for end worm.
Station 118 01
CTD 5, big Rosette.
Bottle N15 - stopcock
difficult to close.
DLOG - autosal - 109 salt
too hight (qflg = 4). Large difference between
bath temp. and sample temp.
Salt drift due to evaporation?
107 - salt too hight (qflg =
3)
102 - salt too hight (qflg =
4)
Station 119 01
CTD 5, big Rosette.
Some double samples for
optics. Duplicates delete from H00. Save in H00.svd.
DLOG - autosal - 106 salt
too hight (qflg = 4). Large difference between
bath temp. Salt drift due to
evaporation?
Station 120 01
CTD 5, big Rosette.
Surface - double sample for
optics. Duplicate delete from H00.
Save in H00.svd.
DLOG - 105 SiO3 hight (qflg
= 3).
Station 121 01
CTD 5, big Rosette.
CTD - no comment.
DLOG - 102 oxy hight (qflg
= 3).
Station 122 01
CTD 5, big Rosette.
CTD - no comment.
Leg 2, northern Japan Sea
Station 123 01
CTD 5, big Rosette.
No record on the VCR.
DLOG - 105 - salt. Diff C
and S hight. Hight temp. grad.
Probably OK (qflg = 2).
Station 124 01
CTD 5, big Rosette.
Some double samples for
optics. Duplicates delete from H00. Save in H00.svd.
DLOG - AUTOSAL - shange
bottles number in rs\12301 and rs\12301.lst.
save wrong value in
rs\12301.svd and rs\12301d.lst.
Station 125 01
CTD 5, big Rosette.
SLOG - Bottle N5 - vent did
not closed
Station 126 01
CTD 5, big Rosette.
SLOG - Bottle N10 - stopcock
broken during recovery, samples taken.
DLOG - AUTOSAL files -
change station number from 127 to 126 (126 - correct).
Station 127 01
CTD 5, big Rosette.
Some double samples for
optics. Duplicates delete from H00. Save in H00.svd.
DLOG -AUTOSAL - Bad salt.
End worm std = 2.00580. Too hight to standardize.
Station 128 01
CTD 5, big Rosette.
DLOG -AUTOSAL - Bad salt.
End worm std = 2.00580. Too hight to standardize.
Change AUTOSAL N 503 on AUTOSAL N
268.
Station 129 01
CTD 5, big Rosette.
No comment
Station 130 01
CTD 5, big Rosette.
No comment
Station 131 01
CTD 5, big Rosette.
No comment
Station 132 01
CTD 5, big Rosette.
No comment.
Station 133 01
CTD 5, big Rosette.
Some double samples for
optics. Duplicates delete from H00. Save in H00.svd.
DLOG - 104 - salt hight
(qflg = 3).
Station 134 01
CTD 5, big Rosette.
DLOG - AUTOSAL - two end
worm value.
Station 135 01
CTD 5, big Rosette.
DLOG - 112 - salt too hight
(qflg = 4). In file H00 shange on -9.0000. Save
in H00.svd
Station 136 01
CTD 5, big Rosette.
Station 137 01
CTD 5, big Rosette.
DLOG -AUTOSAL - Bad salt.
End worm std = 2.00469 too hight to standardize.
Edit files RS\13701 and 13701.lst for checking salinity.
Original files saved as RS\13701.svd and 13701d.list.
Station 138 01
CTD 5, big Rosette.
DLOG -AUTOSAL - Bad salt.
End worm std = 2.00469 too hight to standardize.
Edit files RS\13701 and 13701.lst for checking salinity.
Original files saved as RS\13701.svd and 13701d.list.
Station 139 01
CTD 5, big Rosette.
Station 140 01
CTD 5, big Rosette.
Station 141 01
CTD 5, big Rosette.
Some double samples for
optics. Duplicates delete from H00. Save in H00.svd.
DLOG - change bottle number
in rs\13901 according Small Sample Log
Station 142 01
CTD 5, big Rosette.
One stick of hook lost
during recovery CTD.
Some double samples for
optics. Duplicates delete from H00. Save in H00.svd.
CTD oxygen bad.
DLOG - AUTOSAL - wrong
samples number from 010 to end. Change according
Sample Log in rs\14701 and
14701.list files. Save old as 14701.svd and
14701d.list.
Station 143 01
CTD 5, big Rosette.
New CTD oxygen sensor
installed before station.
Station 144 01
CTD 5, big Rosette.
DLOG - 103 - low salinity
(qflg = 3)
101 - salinity too hight
(qflg=4)
Station 145 01
CTD 5, big Rosette.
Some double samples for
optics. Duplicates delete from H00. Save in H00.svd.
CTD acquisition computer
error on downcast. Computer restarted as cast 2.
Record in two files -
14501.raw and 14502. raw. Continous record on VCR.
File 14503.raw - rewrite
from VCR.
DLOG - Files 14501.bot and
14502.bot save in 14501d.bot and 14502d.bot.
14502.bot renamed in
14501.bot. New 14501.bot used in H00 file.
Station 146 01
CTD 5, big Rosette.
DLOG - 119 - NO2 too hight
(qflg=3).
120 - diff C and S too hight.
Strong grad. Probably OK (qflg=2)
Station 147 01
CTD 5, big Rosette.
DLOG - 108 -no oxygen, bad
titration.
Station 148 01
CTD 5, big Rosette.
Some double samples for
optics. Duplicates delete from H00. Save in H00.svd.
DLOG - AUTOSAL - ship
electricity system break during measurements.
No end worm std.
RS\files - 14801 -added worm
end std R1=1.99979 R2=199979.
Save original as 14801.svd
Station 149 01
CTD 5, big Rosette.
Some double samples for
optics. Duplicates delete from H00. Save in H00.svd.
DLOG - AUTOSAL - ship
electricity system break during measurements.
No end worm std.
New worm std after bottle 107.
RS\files - 14901.svd and
14901d.lst - part down to 0107
typed handly from 14801 and
14801.lst.
Files 14901 and 14901.lst
after edition. Added real worm 0100
std R1=1.99979 and R2=199979.
Deleted typed lines. From 0108 -
real salt data.
14901.bot only 18 trips (19 OK).
Duplicated 016 trip values
for 017 in H00 file.
Station 150 01
CTD 5, big Rosette.
Rosette catch fisherman
wire during recovery.
DLOG - 107 - no oxy due to
bad titration.
Station 151 01
CTD 5, big Rosette.
DLOG - 121 - no oxy due to
wrong titration.
Station 152 01
CTD 5, big Rosette.
DLOG - autosal files
RS\15201 and 15201.lst after edition. Deleted
wrong lines. Save original as
15201d.lst and 15201.svd.
Station 153 01
CTD 5, big Rosette.
DLOG - autosal - files
15301 and 15301.lst - deleted first 0102 line
(typed wrong value) and first
end worm value. Save in 15301.svd
and 15301d.lst.
Station 154 01
CTD 5, big Rosette.
Station 155 01
CTD 5, big Rosette.
DLOG - autosal - 0115-
deleted first 0115 line with wrong salt.
Operator's mistake-first 0115=0116. Save in rs\15501.svd
Station 156 01
CTD 5, big Rosette.
Station 157 01
CTD 5, big Rosette.
Some double samples for
optics. Duplicates delete from H00. Save in H00.svd.
Station 158 01
CTD 5, big Rosette.
DLOG - autosal - two 0115
lines. Operator's mistakes.
First is wrong, deleted. Save
in RS\15801.svd
Station 159 01
CTD 5, big Rosette.
Double sample for optics
near surface. Duplicate delete from H00. Save in H00.svd.
Station 160 01
CTD 5, big Rosette.
SLOG - Bottle 24 close in
air
Wire damaged, cut dangerous
part.
Records on VCR stop during
station.
DLOG - salt sample bottles
N 7, 17 brouken.
Station 161 01
CTD 5, big Rosette.
Station 162 01
CTD 5, big Rosette.
SLOG - altimetr did not
work.
DLOG - 102 - salt hight
(qflg=3)
112 - salt hight (qflg=3)
116 - salt low (qflg=3)
Station 163 01
CTD 5, big Rosette.
Some double samples for
optics. Duplicates delete from H00. Save in H00.svd.
(ldt 10/10/99: DAB in sum
file must be wrong - says close to
bottom but station ends at
about 2000)
Station 164 01
CTD 5, big Rosette.
Station 165 01
CTD 5, big Rosette.
DLOG - Autosal - St. 165
processed as 164. Rename files rs\
16401 in 16501. Change number of station and box number.
Save in rs\16501.svd and
16501d. lst.
Station 166 01
CTD 5, big Rosette.
DLOG - Autosal -
Operator's mistake. Change box
number from 003 on 004
according Sample Log Sheet.
bottle 12 - SiO3 low (qflg =
3).
Station 167 01
CTD 5, big Rosette.
Station 168 01
CTD 5, big Rosette.
Station 169 01
CTD 5, big Rosette.
Station 170 01
CTD 5, big Rosette.
DLOG - 105 NO3 low. Local
oxy max. Probably OK (qflg=2)
Station 171 01
CTD 5, big Rosette.
Some double samples for
optics. Duplicates delete from H00. Save in H00.svd.
Station 172 01
CTD 5, big Rosette.
DLOG - salt 108 - lid
broken (qflg=4).
104 - salt hight (qflg=3)
Station 173 01
CTD 5, big Rosette.
SLOG - bottle N 18 -no
sample for nutrients.
07 08 1999 - Computer virus
"monkey" find on OXY f-disk.
Cheking all f-disks and this computer.
No virus.
Station 174 01
CTD 5, big Rosette.
Station 175 01
CTD 5, big Rosette.
SLOG - altimetr did not work.
Station 176 01
CTD 5, big Rosette.
Some double samples for
optics. Duplicates delete from H00. Save in H00.svd.
DLOG 114 -no oxy.
(note that DAB in sum file
is wrong - station does not go to bottom
10/9/99 ldt)
Station 177 01
CTD 5, big Rosette.
Some double samples for
optics. Duplicates delete from H00. Save in H00.svd.
Station 178 01
CTD 5, big Rosette.
Some double samples for
optics. Duplicates delete from H00. Save in H00.svd.
SLOG - freons -bottle N6
-lid broken
salinity - two end worm std.
First deleted, save in rs\17801.svd.
Station 179 01
CTD 5, big Rosette.
DLOG - 102 -oxy hight
(qflg=4)
Station 180 01
CTD 5, big Rosette.
SLOG - Noble G from bottle
N5 -tube broken. Samples from bottle N6.
Some double samples for
optics. Duplicates delete from H00. Save in H00.svd.
Station 181 01
CTD 5, big Rosette.
Station 182 01
CTD 5, big Rosette.
Surface double sample for
optics. Duplicates delete from H00. Save in H00.svd.
SLOG - Before St. 182
change position of bottles N 1 and
2 on Rosette.
Bottle N 1 replace on place N 2,
bottle N2 on N 1. Change bottles mark.
Station 183 01
CTD 5, big Rosette.
Station 184 01
CTD 5, big Rosette.
Station 185 01
CTD 5, big Rosette.
SLOG - Bottle N 10 air leak
prior to venting.
Station 186 01
CTD 5, big Rosette.
Station 187 01
CTD 5, big Rosette.
Station 188 01
CTD 5, big Rosette.
Station 189 01
CTD 5, big Rosette.
Station 190 01
CTD 5, big Rosette.
CTD only.
(WHY??? any log book notes?
ldt 9/10/99)
Use this cast since cast 3
has bad offsets
Station 190 02
CTD 5, big Rosette.
Only CTD - Upcast from 1850
m. No confirm after bottle N 7.
No sampling, station repited as cast 3.
Station 190 03
CTD 5, big Rosette.
CTD conductivity offset
downcast.
(NOTE LDT 9/10/99: offset is 1090-1136 and 1232-1304 - Use CAST 1!
Looks like slime.)
Station 191 01
CTD 5, big Rosette.
Surface double samples for
optics. Duplicates delete from H00. Save in H00.svd.
Station 192 01
CTD 5, big Rosette.
CTD - winch stop upcast
Surface double samples for
optics. Duplicates delete from H00. Save in H00.svd.
Station 193 01
CTD 5, big Rosette.
Surface double sample for
optics. Duplicates delete from H00. Save in H00.svd.
SLOG - Bottle N15 -no
confirmation at 400 db? (did not push fair button ?).
Bottle N 15 close at 300 db.
CTD - winch stop upcast
Station 194 01
CTD 5, big Rosette.
SLOG - vent of bottle N 2
did not close strongly, leak slightly.
DLOG - oxy bottle N 1 hight
(qflg=4).
Station 195 01
CTD 5, big Rosette.
Station 196 01
CTD 5, big Rosette.
CTD - Bottle N 1 and 2 - no
confirmations on SBE deck unit. Change SBE unit.
Open upcast file 19602.
Station 196 02
CTD 5, big Rosette.
Surface double sample for
optics. Duplicates delete from H00. Save in H00.svd.
SLOG - CTD upcast. Bottle 1
- no comfirmation.
DLOG - salt, oxygen, nutrients
processed as ...19601... Change
files name and cast number in
files.
DLOG - Bottles N 1,2,3
-same depth, oxy diffrent.
Station 197 01
CTD 5, big Rosette.
Surface double sample for
optics. Duplicates delete from H00. Save in H00.svd.
Station 198 01
CTD 5, big Rosette.
Station 199 01
CTD 5, big Rosette.
Station 200 01
CTD 5, big Rosette.
SLOG - N 2,4,6 - double
samples for oxygen.
Station 201 01
CTD 5, big Rosette.
Station 202 01
CTD 5, big Rosette.
Station 203 01
CTD 5, big Rosette.