Cruise Report ONR Japan/East Sea
Hydrographic survey
R/V Revelle HNRO7 24 June 1999 – 17 July 1999
November 1999; CTD updated April 2006
Table of contents
A. Cruise narrative
A.1. Highlights: Expedition; Chief Scientist; Ship; Ports of
Call; Cruise dates
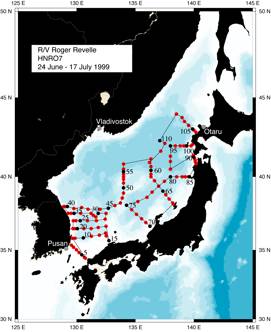
A.2. Cruise summary and cruise track
A.3. Narrative
A.4. Interlaboratory comparisons of chemistry methods
A.5. List of principal investigators
A.6. Cruise participants
B. Description of measurement techniques and calibration
B.1. CTD (conductivity-temperature-depth): Carl Mattson and Mary
Johnson (SIO/ODF)
B.2. Salinity analyses: Carl Mattson (SIO/ODF)
B.3. Oxygen water sample analyses: Carl Mattson and Ron Patrick
(SIO/ODF)
B.4. Nutrient analyses: Carl Mattson and Doug Masten (SIO/ODF)
B.5. Chlorofluorocarbon measurements: Mark Warner and DongHa Min
(UW)
B.6. Alkalinity and pH: Dong-Jin Kang (SNU) and Pavel Tischenko
(POI)
B.7. Noble Gas and Tritium Sampling: Clare Postlethwaite (SOC)
B.8. Oxygen Isotope Sampling: Clare Postlethwaite (SOC)
B.9. Other SNU sampling (helium, tritium, D-14, Del 18O, SF6):
Dong-Jin Kang (SNU)
B.10. Underway pCO2 measurements: Dong-Jin Kang, Doshik Hahm
(SNU)
B.10.a. pCO2 measurements
B.10.b. Thermosalinograph measurements
B.10.c. Underway chlorophyll sampling
B.11. Acoustic doppler current profiling (ADCP): Lynne Talley
(SIO)
B.11.a. Lowered ADCP
B.11.b. Underway ADCP
B.12. Meteorology: R/V Revelle (Talley; SIO)
B.13. Navigation: R/V Revelle (Talley; SIO)
B.14. Bathymetry: R/V Revelle (Talley; SIO)
B.15. Video Plankton Recorder (VPR): Carin Ashjian (WHOI)
B.16. Plankton net tows: Carin Ashjian and Cabell Davis (WHOI)
B.17. Bio-optical studies: Greg Mitchell (SIO)
C. Distribution of data and samples to groups other than
originating principal investigators
Appendix A: CTD data quality comments
Appendix B: Bottle data quality
comments
A. Cruise narrative
A.1. Highlights
a. Expedition
HNRO7 (Expedition Hahnaro Leg 7)
b. Chief Scientist
Lynne D. Talley
Scripps Institution of Oceanography 0230
La Jolla, CA 92093-0230 USA
ltalley@ucsd.edu
c. Ship
R/V Revelle, Captain David Murline
d. Ports of Call
Pusan, Korea
e. Cruise dates
24 June 1999 - 17 July 1999
A.2. Cruise summary
a. Cruise track (Fig. A.1)
Link to list of events, from ship's
officers, with all station (CTD, optical, net tow) and VPR towing times.
Station
locations and times in WOCE Hydrographic Programme format. (Link is to complete file; Table is
compressed with some information removed, and in small font)
JES SUMMER 99 (TALLEY) RV REVELLE HNRO LEG 7
SHIP/CRUISE
UTC
POSITION
UNC HT ABOVE METER NO.OF
EXPOCODE STNNBR CASTNO DATE TIME CODE LATITUDE LONGITUDE NAV DEPTH BOTTOM
WHEEL BOTTL PARAM COMMENTS
-----------------------------------------------------------------------------------------------------------------------------
33RRHNRO/7 001
01 062499 1255 BO 35 21.0 N
129 33.0 E GPS 120 8 110 8
1-8,20,24,26,27,53 CTD#3
33RRHNRO/7 002 01
062499 1608 BO 35 11.8 N 129 44.2 E
GPS 140 6 130 9 1-8,20,24,26,27,53 CTD#3
33RRHNRO/7 003
01 062499 1846 BO 35 00.5 N
129 58.7 E GPS 133 8 125 9
1-8,24,26,27,53 CTD#3
33RRHNRO/7 004
01 062499 2119 BO 34 49.9 N
130 11.9 E GPS 124 6 124 9 1-10,15,17,20,24,26,27,53 CTD#3
33RRHNRO/7 005
01 062499 2358 BO 34 40.0 N
130 26.1 E GPS 131 7 122 10
1-8,24,26,27
CTD#3
33RRHNRO/7 006
02 062599 0303 BO 34 30.2 N
130 39.0 E GPS 118 18 100 17
1-8,24,26,27
CTD#3
33RRHNRO/7 007
01 062599 0439 BO 34 25.55 N 130 43.88 E GPS 96 8 85 8 1-6,24,26
CTD#3
33RRHNRO/7 008
01 062599 1317 BO 35 50.05 N 129 38.04 E GPS 122
6
113 11 1-8,24,26,27,53 CTD#3
33RRHNRO/7 009
02 062599 1714 BO 35 50.3 N
129 51.4 E GPS 995 8 987 20
1-8,24,26,27,53 CTD#5
33RRHNRO/7 010
01 062599 2303 BO 35 52.06 N 130 34.0 E GPS 1393 5 1360 24
1-10,15,17,24,26,27,53
CTD#5
33RRHNRO/7 011
02 062699 0430 BO 35 57.5 N
131 14.99 E GPS 1253 6 1220 24
1-8,24,26,27
CTD#5
33RRHNRO/7 012
02 062699 1020 BO 36 02.98 N 131 55.79 E GPS 1157
8
1128 20 1-8,24,26,27
CTD#5
33RRHNRO/7 013
01 062699 1436 BO 36 12.
N 132 27.6 E GPS 1074 7 1045 19
1-10,15,17,20,24,26,27
CTD#5
33RRHNRO/7 014
01 062699 1739 BO 36 00.2 N
132 31.8 E GPS 269 7 258 9
1-8,20,24,26,27,53 CTD#5
33RRHNRO/7 015
01 062699 2100 BO 35 40.12 N 132 45. E GPS
132 8 128 8 1-8,24,26,27 CTD#5
33RRHNRO/7 016
02 062799 0332 BO 36 40.33 N 132 30.03 E GPS 1120
7
1187 24 1-8,24,26,27
CTD#5
33RRHNRO/7 017
02 062799 0948 BO 36 35.4 N
131 50.1 E GPS 1834 7 1790 24
1-8,24,26,27
CTD#5
33RRHNRO/7 018
01 062799 1457 BO 36 30.3 N
131 14.0 E GPS 2051 7 2007 24
1-8,20,24,26,27,53 CTD#5
33RRHNRO/7 019
01 062799 2015 BO 36 30.25 N 130 37.38 E GPS 2033
5
1992 24 1-8,24,26,27,53 CTD#5
33RRHNRO/7 020
02 062899 0117 BO 36 30.29 N 130 02.99 E GPS 1380
6
1335 23 1-8,20,24,26,27
CTD#5
33RRHNRO/7 021
01 062899 0330 BO 36 30.03 N 129 50.2 E GPS 329 8 320 12
1-8,24,26,27,53 CTD#5
33RRHNRO/7 022
01 062899 0506 BO 36 30.1 N
129 40.4 E GPS 118 7 112 14
1-8,24,26,27
CTD#5
33RRHNRO/7 023
01 062899 0832 BO 37 03.4 N
129 42.3 E GPS 298 7 289 9
1-10,15,17,24,26,27,53
CTD#5
33RRHNRO/7 024
01 062899 1027 BO 37 03.4 N
129 56.4 E GPS 1010 6 989 19
1-8,24,26,27,53 CTD#5
33RRHNRO/7 025
01 062899 1303 BO 37 03.4 N
130 18.7 E GPS 2200 7 2159 24
1-8,24,26,27,53 CTD#5
33RRHNRO/7 026
01 062899 1858 BO 37 03.45 N 130 56.18 E GPS 2207
6
2170 24
1-10,12,15,17,20,24,26,27,53 #5
33RRHNRO/7 027
01 062999 0105 BO 37 03.4 N
131 41.0 E GPS 2170 7 2117 24 1-8,24,26,27
CTD#5
33RRHNRO/7 028
02 062999 0757 BO 37 09.9 N
132 26.6 E GPS 775 8 755 21
1-8,24,26,27,53 CTD#5
33RRHNRO/7 029
01 062999 1121 BO 37 33.4 N
132 30. E GPS 1670 10 1655 21 1-8,24,26,27,53 CTD#5
33RRHNRO/7 030
01 062999 1648 BO 37 33.2 N
131 50.1 E GPS 2376 4 2329 24
1-10,15,17,24,26,27,53
CTD#5
33RRHNRO/7 031
01 062999 2112 BO 37 18.0 N
131 38.0 E GPS 2230 6 2192 24
1-8,24,26,27
CTD#5
33RRHNRO/7 032
01 063099 0021 BO 37 25.0 N
131 25.0 E GPS 2240 8 2200 24
1-8,24,26,27,53 CTD#5
33RRHNRO/7 033
02 063099 0401 BO 37 33.2 N
131 14.5 E GPS 2167 7 -9 24 1-8,24,26,27,53 CTD#5
33RRHNRO/7 034
02 063099 1059 BO 37 33.3 N
130 21.2 E GPS 1599 8 -9 22 1-8,24,26,27,53 CTD#5
33RRHNRO/7 035
01 063099 1532 BO 37 33.3 N
129 45.3 E GPS 1062 7 1038 19
1-8,24,26,27
CTD#5
33RRHNRO/7 036
01 063099 1800 BO 37 33.0 N
129 30.2 E GPS 570 6 568 16
1-8,24,26,27,53 CTD#5
33RRHNRO/7 037
01 063099 2006 BO 37 33.0 N
129 16.0 E GPS 227 6 220 15
1-8,20,24,26,27 CTD#5
33RRHNRO/7 038
01 063099 2324 BO 38 01.0 N
128 53.0 E GPS 501 6 485 18
1-10,15,17,24,26,27 CTD#5
33RRHNRO/7 039
01 070199 0117 BO 38 01.0 N
128 56.8 E GPS 1077 7 1040 16
1-8,24,26,27,53 CTD#5
33RRHNRO/7 040
02 070199 0439 BO 38 01.5 N
129 11.8 E GPS 1154 6 -9 24 1-8,24,26,27,53 CTD#5
33RRHNRO/7 041
01 070199 0905 BO 37 53.7 N
129 44.1 E GPS 1626 7 1619 24
1-8,20,24,26,27 CTD#5
33RRHNRO/7 042
01 070199 1402 BO 37 57.
N 130 25. E GPS 1845 7 1838 24
1-8,24,26,27,53 CTD#5
33RRHNRO/7 043
01 070199 1832 BO 37 49.9 N
130 58.3 E GPS 1250 7 1319 24
1-8,24,26,27,53 CTD#5
33RRHNRO/7 044
01 070299 0151 BO 37 50.0 N
132 00.0 E GPS 2636 7 2595 24
1-8,24,26,27,53 CTD#5
33RRHNRO/7 045
02 070299 0842 BO 37 53.8 N
132 41.8 E GPS 2530 7 2487 24
1-10,15,17,20,24,26,27
CTD#5
33RRHNRO/7 046
01 070299 1321 BO 38 05.
N 133 15. E GPS 1756 8 1748 23
1-8,24,26,27,53 CTD#5
33RRHNRO/7 047
01 070299 1707 BO 38 14.8 N
133 44.4 E GPS 934 6 907 18
1-10,15,17,20,24,26,27,53 CTD#5
33RRHNRO/7 048
01 070299 2123 BO 38 35.0 N
133 53.0 E GPS 1359 8 1327 23
1-8,24,26,27,53 CTD#5
33RRHNRO/7 049
01 070399 0037 BO 38 55.0 N
134 00.0 E GPS 744 6 730 20
1-8,24,26,27,53 CTD#5
33RRHNRO/7 050
02 070399 0512 BO 39 15.8 N
133 59.9 E GPS 2114 8 2074 24
1-10,15,17,24,26,27,53
CTD#5
33RRHNRO/7 051
01 070399 0848 BO 39 44.7 N
134 00.0 E GPS 1004 7 982 18
1-8,24,26,27,53
CTD#5
33RRHNRO/7 052
01 070399 1113 BO 39 50.
N 134 00. E GPS 560 8 543 15
1-8,24,26,27,53 CTD#5
33RRHNRO/7 053
01 070399 1319 BO 40 00.
N 134 00. E GPS 1033 8 999 19
1-8,24,26,27,53
CTD#5
33RRHNRO/7 054
01 070399 1530 BO 40 09.8 N
134 00.1 E GPS 1132 10 1090 24
1-8,24,26,27
CTD#5
33RRHNRO/7 055
01 070399 1820 BO 40 19.9 N
133 59.9 E GPS 2452 6 2435 22
1-8,20,24,26,27 CTD#5
33RRHNRO/7 056
01 070399 2136 BO 40 30.0 N
134 00.0 E GPS 3140 6 3095 24
1-8,24,26,27
CTD#5
33RRHNRO/7 057
01 070499 0155 BO 40 50.0 N
134 00.0 E GPS 3530 7 3487 24
1-10,12,15,17,20,24,26,27 CTD#5
33RRHNRO/7 058
01 070499 1322 BO 41 10.
N 136 20. E GPS 3450 8 3405 24
1-10,15,17,20,24,26,27,53 CTD#5
33RRHNRO/7 059
01 070499 1909 BO 40 40.2 N
136 20.0 E GPS 3217 7 3175 24
1-8,24,26,27,53 CTD#5
33RRHNRO/7 060
01 070499 2252 BO 40 25.0 N
136 20.0 E GPS 2900 7 2900 24
1-8,20,24,26,27,53 CTD#5
33RRHNRO/7 061
02 070599 0250 BO 40 10.0 N
136 20.0 E GPS 1773 7 1735 24
1-8,24,26,27,53 CTD#5
33RRHNRO/7 062
02 070599 0601 BO 40 00.1 N
136 20.1 E GPS 1783 7 1749 24
1-8,24,26,27,53 CTD#5
33RRHNRO/7 063
01 070599 0948 BO 39
44.1 N 136 37.8 E GPS 2214
8
2168 22 1-8,24,26,27,53 CTD#5
33RRHNRO/7 064
01 070599 1506 BO 39 23.
N 136 59. E GPS 2522 7 2476 24
1-10,15,17,24,26,27,53
CTD#5
33RRHNRO/7 065 01 070599 2018 BO 39 02.2 N
137 21.1 E GPS 2274 7 2242 24
1-8,24,26,27,53 CTD#5
33RRHNRO/7 066
01 070599 2358 BO 38 48.0 N
137 36.0 E GPS 2178 7 2153 24
1-8,20,24,26,27 CTD#5
33RRHNRO/7 067
02 070699 0436 BO 38 31.
N 137 58.8 E GPS 1905 8 1862 24
1-10,15,17,24,26,27,53
CTD#5
33RRHNRO/7 068
02 070699 0929 BO 38 14.6 N
138 10.5 E GPS 1356 7 1313 24
1-8,24,26,27,53 CTD#5
33RRHNRO/7 069
01 070699 1106 BO 38 11.
N 138 14.3 E GPS 280 7 262 14
1-8,24,26,27,53
CTD#5
33RRHNRO/7 070
01 070699 2157 BO 36 40.0 N
136 15.0 E GPS 222 8 222 18
1-8,24,26,27
CTD#5
33RRHNRO/7 071
02 070799 0209 BO 36 55.1 N
135 53.9 E GPS 626 6 615 21
1-8,24,26,27,53 CTD#5
33RRHNRO/7 072
01 070799 0549 BO 37 11.
N 135 32.1 E GPS 1739 8 1702 24
1-8,20,24,26,27 CTD#5
33RRHNRO/7 073
01 070799 1043 BO 37 29.1 N
135 06. E GPS 2933 8 2890 24
1-8,24,26,27,53 CTD#5
33RRHNRO/7 074
01 070799 1539 BO 37 48.0 N
134 40.9 E GPS 2983 6 2942 24
1-10,15,17,24,26,27 CTD#5
33RRHNRO/7 075
01 070799 2024 BO 38 06.1 N
134 14.9 E GPS 473 7 464 16
1-8,24,26,27,53 CTD#5
33RRHNRO/7 076
01 070899 0306 BO 38 21.
N 135 13. E GPS 3005 8 2964 23
1-10,12,15,17,20,24,26,27 CTD#5
33RRHNRO/7 077
02 070899 1053 BO 38 38.
N 136 00. E GPS 2725 6 2682 24
1-10,15,17,24,26,27,53
CTD#5
33RRHNRO/7 078
01 070899 1558 BO 38 59.1 N
136 27.0 E GPS 2658 7 2615 24
1-8,24,26,27 CTD#5
33RRHNRO/7 079
01 070999 0043 BO 39 42.0 N
137 29.0 E GPS 2586 7 2548 24
1-8,20,24,26,27 CTD#5
33RRHNRO/7 080
02 070999 0720 BO 39 59.8 N
138 00.1 E GPS 2420 8 2378 24
1-10,15,17,20,24,26,27,53 CTD#5
33RRHNRO/7 081
01 070999 1149 BO 40 00.
N 138 32. E GPS 2272 8 2226 24
1-8,24,26,27
CTD#5
33RRHNRO/7 082
01 070999 1548 BO 40 00.1 N
138 59.8 E GPS 1974 6 1940 24
1-8,24,26,27,53 CTD#5
33RRHNRO/7 083
01 070999 1846 BO 40 00.0 N
139 15.8 E GPS 1635 6 1610 24
1-8,24,26,27,53 CTD#5
33RRHNRO/7 084
01 070999 2118 BO 40 00.0 N
139 32.5 E GPS 972 7 958 24
1-8,24,26,27,53 CTD#5
33RRHNRO/7 085
01 070999 2252 BO 40 00.0 N
139 37.1 E GPS 315 7 358 22
1-8,24,26,27,53 CTD#5
33RRHNRO/7 086
01 071099 0453 BO 40 51.
N 140 10.9 E GPS 64 8 58 7 1-8,24,26,27,53 CTD#5
33RRHNRO/7 087
02 071099 0627 BO 40 56.9 N
140 08.1 E GPS 119 7 116 13
1-8,24,26,27,53 CTD#5
33RRHNRO/7 088
01 071099 0739 BO 41 03.9 N
140 06.1 E GPS 152 7 148 8
1-10,15,17,20,24,26,27,53 CTD#5
33RRHNRO/7 089
01 071099 0855 BO 41 11.
N 140 03.2 E GPS 121 7 120 8 1-10,15,17,20,24,26,27 CTD#5
33RRHNRO/7 090
01 071099 1001 BO 41 17.
N 139 59.9 E GPS 160 8 158 8
1-8,24,26,27,53 CTD#5
33RRHNRO/7 091
01 071099 1115 BO 41 24.
N 139 57. E GPS 120 8 115 8 1-10,15,17,24,26,27,53 CTD#5
33RRHNRO/7 092
01 071099 2048 BO 40 30.0 N
138 00.0 E GPS 3328 7 3280 24
1-8,24,26,27,53 CTD#5
33RRHNRO/7 093
01 071199 0209 BO 41 00.0 N
138 00.0 E GPS 3675 7 3630 24
1-10,15,17,24,26,27 CTD#5
33RRHNRO/7 094
02 071199 0909 BO 41 29.9 N
138 00. E GPS 3693 9 3646 24
1-10,15,17,24,26,27,53
CTD#5
33RRHNRO/7 095
01 071199 1443 BO 41 59.7 N
138 00.4 E GPS 3685 8 3647 24
1-10,12,15,17,20,24,26,27 CTD#5
33RRHNRO/7 096
01 071199 1938 BO 42 00.0 N
138 24.9 E GPS 3696 8 3648 24
1-10,15,17,24,26,27,55
CTD#5
33RRHNRO/7 097
01 071199 2353 BO 42 00.0 N
138 50.0 E GPS 3618 4 3585 24
1-8,24,26,27,53 CTD#5
33RRHNRO/7 098
02 071299 0429 BO 42 00.
N 139 08. E GPS 3333 9 3283 24 1-8,24,26,27,53 CTD#5
33RRHNRO/7 099
02 071299 0750 BO 42 00.
N 139 15.8 E GPS 2405 10 2350 24
1-8,24,26,27,53 CTD#5
33RRHNRO/7 100
01 071299 1004 BO 42 00.
N 139 22.8 E GPS 1111 8 1104 21 1-8,24,26,27,53 CTD#5
33RRHNRO/7 101
01 071299 1307 BO 42 00.
N 139 44.9 E GPS 1206 8 1170 20
1-8,24,26,27,53 CTD#5
33RRHNRO/7 102
01 071299 1435 BO 42 04.5 N
139 52.3 E GPS 136 8 133 10
1-8,24,26,27,53 CTD#5
33RRHNRO/7 103
01 071299 1943 BO 42 52.0 N
140 10.0 E GPS 124 5 121 14
1-10,15,17,24,26,27,53
CTD#5
33RRHNRO/7 104
01 071299 2152 BO 42 59.6 N
139 59.5 E GPS 1340 6 1317 24
1-8,24,26,27
CTD#5
33RRHNRO/7 105
01 071399 0004 BO 43 04.0 N
139 53.0 E GPS 2189 7 2119 24
1-8,20,24,26,27 CTD#5
33RRHNRO/7 106
02 071399 0500 BO 43 18.1 N
139 33. E GPS 2596 8 2582 24
1-8,24,26,27
CTD#5
33RRHNRO/7 107
01 071399 0910 BO 43 32.1 N
139 12.1 E GPS 3213 8 3170 24
1-10,15,17,24,26,27 CTD#5
33RRHNRO/7 108
01 071399 1340 BO 43 47.
N 138 50. E GPS 3474 8 3426 24
1-8,12,24,26,27 CTD#5
33RRHNRO/7 109
01 071399 1800 BO 43 59.9 N
138 30.1 E GPS 3173 6 3126 24
1-10,15,17,20,24,26,27
CTD#5
33RRHNRO/7 110
02 071499 0645 BO 42 19.9 N
137 04.9 E GPS 3681 9 3626 24
1-8,24,26,27
CTD#5
33RRHNRO/7 111
01 071499 1130 BO 42 10.1 N
137 30.9 E GPS 3680 8 3632 24
1-10,15,17,24,26,27 CTD#5
33RRHNRO/7 112
01 071499 2133 BO 41 40.0 N
137 10.0 E GPS 3637 8 3580 24
1-8,24,26,27,53 CTD#5
33RRHNRO/7 113
01 071599 0420 BO 40 56.0 N
136 11.7 E GPS 3394 -9 800 24
1
CTD#3
b. Station sampling
113 CTD/24-bottle rosette stations; 112 stations included LADCP
(2156 bottles tripped)
Water sampling to the bottom for temperature, salinity, oxygen,
transmissometer, nitrate, phosphate, silicate, nitrite, CFC's, pH, alkalinity,
C14, del18O, helium, tritium, argon, neon. Surface sampling at selected station
locations for delta-C13, phytoplankton growth rates and calcite. Average depth
of cast: 2500 m.
37 Bio-optical casts
15 Net tows near the surface
c. Underway sampling
towed VPR (Video Plankton Recorder), with planktonic taxonomic type and
abundance, temperature, conductivity, fluorescence, light attenuation and PAR
yoyoing to 80 meters depth once or twice between CTD stations.
pCO2
surface temperature and salinity
Seabeam center beam bathymetry
Knudsen echo sounder bathymetry
ADCP (Acoustic Doppler Current Profiling)
meteorology
d. Floats and drifters
2 Minimet surface drifters
2 Profiling ALACE floats ballasted to 800 meters
A.3. Narrative
The R/V Revelle departed Pusan, Korea on June
24, 1999 at 1600 in good weather and returned on July 17. This was the seventh
leg of the Hahnaro (HNRO) expedition. Generally calm to moderate seas
throughout the cruise. Air temperature was in the 16-22 C range. There was
occasional rain. Three separate sampling programs were aboard:
CTD/rosette/chemistry, bio-optics, and VPR (Video Plankton Recorder). The
cruise leg covered the Korean and Japanese sectors of the Japan/East Sea. The
purposes of the cruise leg were to map the water properties and geostrophic
circulation of the Japan/East Sea from top to bottom, the bio-optical
properties, and the plankton distribution. The water properties and circulation
of the Russian sector were measured in a companion cruise on the Khromov,
following the Revelle leg.
CTD/rosette station sampling was to the bottom
at each of the 112 stations. Most stations were separated by 10 to 30 nautical
miles. The station pattern covered most of the southern and eastern Japan/East
Sea. One station near Dok Do was abandoned because the local Korean patrol was
not aware of our clearance to work. One extra station (113) to 800 m was made
on the return to Pusan in order to test the CTD which will be the backup CTD on
the Khromov. On most stations, 24 samples were collected from top to bottom.
Maximum bottle spacing in the deep waers was 250 meters with some exceptions.
Most sampling in the upper waters was based on the many features in the CTD
salinity and oxygen and the transmissometer. An altimeter on the CTD/rosette
frame was used for the bottom approach on most stations. A pinger on the
CTD/rosette frame was used for several stations. A lowered acoustic doppler
current profiler was used on every station.
The VPR was towed between most station pairs
except for the longer steams between sections. On most days two separate casts
for bio-optics were made. At these stations, extra samples for bio-optical
properties were often collected from near-surface rosette bottles from the CTD
cast.
A plankton net tow was done at 15 stations.
A.4. Interlaboratory comparisons
of chemistry methods
Alkalinity and pH: A comparison of alkalinity and pH
methods between the Seoul National University group under Kyung-Ryul Kim
(Dong-Jin Kang aboard the Revelle) and the Pacific Oceanological Institute
group under Pavel Tishchenko was carried out during the cruise. POI sampling
for pH and alkalinity was at every station. SNU sampling was at 15 stations for
comparison of methods. The results of the comparison are included in section B.6.c.
CFC: Samples for CFCs were collected in glass ampoules for analysis at the
UW laboratory and comparison with analyses carried out on the Revelle. All CFC
sampling on the Khromov will be using these glass ampoules.
A.5. List of
principal investigators
- Lynne Talley: Temperature, salinity, oxygen, nutrients (CTD and rosette): SIO/UCSD
- Lynne Talley and Peter Hacker: Lowered Acoustic Doppler Current Profiling: SIO/UCSD and U. Hawaii
- Lynne Talley: Shipmounted Acoustic Doppler Current Profiling: SIO/UCSD
- Steve Riser: Subsurface PALACE floats: UW
- Dong-Kyu Lee and Peter Niiler: Minimet surface drifters: Pusan University and SIO/UCSD
- Pavel Tischenko: Alkalinity, pH: POI
- Kyung-Ryul Kim: Alkalinity, pH: SNU
- Kyung-Ryul Kim: Carbon 14: SNU
- Kyung-Ryul Kim: Delta 18O: SNU
- William Jenkins: Delta 18O: SOC
- Mark Warner: Chlorofluorocarbons: UW
- William Jenkins: Helium-3, tritium, neon, argon, krypton: SOC
- Kyung-Ryul Kim: Surface pCO2, T, S, chlorophyll, (pN2O): SNU
- Clive Dorman and Robert Beardsley: Shipbased meteorological measurements (WHOI ASIMET): SIO/UCSD and WHOI
- Greg Mitchell: Bio-optical profiles: SIO/UCSD
- Greg Mitchell: Water particle size, absorption, pigments: SIO/UCSD
- Carin Ashjian: Towed video plankton recorder and temperature/salinity: WHOI
- Carin Ashjian: Plankton net tows: WHOI
A.6. Cruise participants
- Lynne Talley (SIO) - Chief scientist - ltalley@ucsd.edu
- David Newton (SIO) - Programmer, LADCP, deck watch - dnewton@ucsd.edu
- Carl Mattson (SIO/ODF) - ODF Tech-in-Charge/Electronics/Deck watch - cmattson@ucsd.edu
- Doug Masten (SIO/ODF) - Nutrient analyst/data processing - dmasten@ucsd.edu
- Ron Patrick (SIO/ODF) - Oxygen/Bottle data - rpatrick@ucsd.edu
- Alexander Nedashkovskiy (POI) - Nutrients
- Sergey Sagalaev (POI) - Oxygen
- Joe Martin (SIO) - Salinity, deck watch, underway ADCP - jmartin@ucsd.edu
- Michael Gorelkin (FERHRI) - Salinity
- Igor Titov (FERHRI) - Electronics, Deck watch
- Vladimir Luchin (FERHRI) - CTD/rosette operations, CTD console - hydromet@online.ru
- Nikolay Rykov (FERHRI) - CTD/rosette operations
- Vladimir Kraynev (FERHRI) - CTD/rosette operations
- Igor Zhabin (POI) - CTD/hydrographic data management, software, processing,deck
- Vladimir Ponamarev (POI)- CTD/hydrographic data management, software, processing
- Pavel Tischenko (POI) - POI chemistry head, CO2 (pH by EMF)
- Ruslan Chichkin (POI) - CO2 (pH by EMF)
- Dong-Jin Kang (SNU) - underway chemistry, CO2 (pH by spectro.)
- Doshik Hahm (SNU) - CO2 (pH by spectro.)
- Elena Ilyina (POI) - CO2 (Alkalinity)
- Maria Shvetsova (POI) - CO2 (Alkalinity)
- Mark Warner (UW) - CFC
- DongHa Min (UW) - CFC
- Clare Postlethwaite (SOC) - helium, tritium, neon, argon
- Carin Ashjian (WHOI) - VPR
- Cabell Davis (WHOI) - VPR
- Larry Costello (WHOI) - VPR
- Philip Alatalo (WHOI) - VPR
- Andrew Girard (WHOI) - VPR
- Gregory McGrath (WHOI) - VPR
- Greg Mitchell (SIO) - Bio-optics
- John Wieland (SIO) - Bio-optics
- Sergei Zakharkov (POI) - Bio-optics
- Jeong-Eon Moon (KORDI) - Bio-optics
- Dan Jacobson (SIO) - Revelle computer technician
- Tammy Koonce (SIO) - Revelle resident marine technician, Deck Watch
Institution acronyms
1. FERHRHI - Far-Eastern Regional Hydrometeorological Research Institute, Vladivostok, Russia
2. SOC - Southampton Oceanograpy Centre, Southampton, UK
3. KORDI - Korea Ocean Research and Development Institute, Seoul, Korea
4. POI - Pacific Oceanological Institute, Far Eastern Branch Russian Academy of Sciences, Vladivostok, Russia
5. SIO - Scripps Institution of Oceanography, University of California San Diego, La Jolla, CA USA
6. SIO/ODF - SIO Oceanographic Data Facility
7. SNU - Seoul National University, Seoul, Republic of Korea
8. UW - University of Washington, School of Oceanography, Box 357940, Seattle, WA 98195 USA
9. WHOI - Woods Hole Oceanographic Institution, Woods Hole, MA USA
B. Description of measurement techniques
and calibration
B.1. CTD
(conductivity-temperature-depth): (SIO/ODF)
B.1.1 Shipboard CTD
report: Carl Mattson (SIO/ODF)
CTD data were recorded on IBM PC's. Digital backups were made on CDROMS and Zip disks. Analog backups were made on VCR cassettes.
CTDs used:
NBIS Model MKIII ODF CTD#3 stations 1-8, 9 (cast 1), 113
NBIS Model MKIII ODF CTD#5 stations 9 (cast 2)-112
The rosette consisted of:
NBIS MKIIIB CTD s/n 01-1095 (ODF ctd#3) sta 1-8, 113
NBIS MKIIIB CTD s/n 01-1070 (ODF ctd#5) sta 9-112
Sensormedics Oxygen Sensor s/n 6-12-07 sta 1-108
Sensormedics Oxygen Sensor s/n 6-12-08 sta 109
Sensormedics Oxygen Sensor s/n 6-02-08 sta 110-113
FSI OTM s/n 1322 sta 113
STS 24 bottle rosette frame
24pl Seabird pylon model SBE32 s/n 3212613-0164
Seabird Temperature Sensor SBE35 s/n 3516590-0011
SIO made Bullister style 10 liter bottles
Benthos Pinger model 2216 s/n 1275
Simrad Altimeter model 807 s/n 0711090
STS Battery Pack for Altimeter
RDI LADCP CS-150KHZ s/n 1546
LADCP Battery Pack
Wetlabs Cstar 25cm transmissometer c/n CST-244DB
Wetlabs Cstar 25cm transmissometer c/n CST-245DB
Comments:
CTD#3:
Conductivity sensor failed during Sta 9 cast 1.
Ctd#3 was replaced by CTD#5 prior to sta 9 cast 2.
FSI OTM #1322 was the second temp sensor on sta 113
The conductivity sensor drifted again on sta 113.
CTD#5:
CTD #5 has dual sensors mounted on twin turrets - two
identical Temperature channels and two identical conductivity channels. CTD
sensors soaked in distilled water between all casts.
Swapped sensor pair in config file starting sta 59.
PRT#2 and COND#2 were the most stable sensor pair so these were used in onboard
data processing operations for both CTD and bottle data reports.
PRT#1 (after about sta92) was observed to jump about 0.0008 deg on casts
greater that 3200M. It was usually observed on the upcasts coming through about
3300M then jumped back to overlap downcast trace when it comes back up - around
3000M. Could be a digital bit sticking in that channel (bit #5?).
Cond#1 sensor has a pressure effect on deep casts and will require a pressure
fit correction.
Bottles:
10L Bullister style, SIO manufactured.
Bottles serial numbered 1-24 corresponded to the pylon tripping sequence 1-24
with the first bottle tripped being bottle #1.
Bottles serial numbered 1-24 were used on all casts.
Thermometers:
The SBE35 Ref temp sensor data was recorded on all
bottle trips.
No DSRT's
CTD oxygen:
Oxygen data interfaced with the CTD and incorporated
into the CTD data stream using a:
Sensormedics Oxygen Sensor s/n 6-12-07 sta 1-108
Sensormedics Oxygen Sensor s/n 6-12-08 sta 109
Sensormedics Oxygen Sensor s/n 6-02-08 sta 110-113
Transmissometer:
Wetlabs Cstar 25cm (Blue) Transmissometer c/n CST-244DB
Wetlabs Cstar 25cm (RED) Transmissometer c/n CST-245DB
Winches:
Forward Markey CTD winch used on all casts
No wire or winch problems throughout the cruise.
Station-Cast number assignments:
Cast numbers were assigned between the CTD and the Bio-Optical profiler depending on which was deployed first. Station 9 was the only station that the CTD was deployed on two casts.
B.1.2. CTDO
(conductivity-temperature-depth-oxygen) final calibrations: Mary C. Johnson
(SIO/ODF)
General
comments. These HNRO7 CTD data are final. Calibrations have been carefully checked, using overlays of
deep theta-salinity profiles plus surface salinity and sigma theta plots vs.
pressure. The missing data from
some of the steeper thermoclines have been interpolated; all
interpolated/extrapolated data are quality-coded 6. Oxygen corrections from the preliminary data sent in 1999
have been applied here as a courtesy; all CTD oxygen data are coded 1
(uncalibrated).
The CTD-5 secondary T/C sensors were used as the "better"
pair; both sensor pairs had significant noise on their upcasts. The numerous offsets and higher noise
level on the T1/C1 downcasts outweighed the down/up "split" seen on
the T2/C2 pair: upcast salinity data were typically 0 to -0.001 PSU vs downcasts
below the thermocline on this leg.
The calibrated downcast CTD data appear to be consistent, and the bottle
salinity data were fairly well centered over the CTD data on the deep
theta-salinity plots.
CTD-3 was used for the first 8 casts, then CTD-5 (with dual T/C
sensors) was used for stations 9-112.
A new C sensor was installed and tested during station 113. This new sensor had a large + drift
with time on both down and up casts.
Its calibration was brought into the realm of probability by applying an
extra S(P**2) correction to the downcast salinity, based on comparison of
"final" corrected salinity to the upcast bottle data.
Comments on individual station problems are found in Appendix A.
Detailed
calibration comments:
HNRO7 CTD Configurations:
NBIS MKIIIB CTD:
s/n 01-1095 (ODF CTD#3) sta 1-8,9/1,113
Pressure s/n 77011
T1 s/n 15778 (T1 apparently has a long response time of 1+ seconds)
T2 NOT PRESENT stas 1-9/1
T2 FSI OTM s/n 1322 sta 113
C1 s/n O17 - cracked/failed sta 9/1 at 270mwo
C1 s/n NEW/UNKNOWN - sta 113/TEST, big + drift
C2 NONE
NBIS MKIIIB CTD:
s/n 01-1070 (ODF CTD#5) sta 9/2-112
Pressure s/n 77017
Dual T/C Sensors mounted on twin turrets:
T1 s/n 15407 (sta.92: T1 jumps abt. +0.001 3300m down/back 3000m up)
C1 s/n O16 (Prs. effect on deep casts, requires a C(P) corrxn).
T2 s/n 17534
C2 s/n O24
Dual Wetlabs Cstar
25cm transmissometers - only on CTD-5 casts
(Blue) c/n CST-244DB
(RED) c/n CST-245DB
Sensormedics Oxygen
Sensors:
O2 s/n 6-12-07 sta 1-108 ("new O2
sensor" sta.2 COLog)
O2 s/n 6-12-08 sta 109 ("new sensor offscale 2020db down")
O2 s/n 6-02-08 sta 110-113
Seabird Temperature
Sensor SBE35 s/n 3516590-0011
CTD Sensor Calibrations:
CTD-3:
Pressure
Sensor s/n 77011 (Paine):
P Calibs:
May
1999 - 0.09/29.88 deg.C bath to
6080/1191 db
Dec.1999
- 0.04/26.93/30.93 deg.C bath to
6080/1191/1191 db
cold cals: shifted -1.25 db from pre-
to post-cruise calibration
warm cals: shifted -1.3+ db from pre-
to post-cruise calibration
Correction used: pre-cruise P calib with 0.65 offset
(in
effect, averaging the two calibs)
Temperature
Sensor s/n 15778 (Rosemount PRT):
T Calibs: May 1999/June 1999/Dec.1999
(June 1999 was only a 2-point
cal to re-check Tcal)
large/~0.18 deg.C slope
from 0-30 deg.C
cold end fairly similar
pre- to post-cruise
warm drops ~0.015 deg.C
change? (Hard to tell with steep
slope)
Correction used: equally weighted May + Dec. 1999 Tcals
(same #pts at each level, same # of levels) - then averaged
Conductivity
Sensor s/n O17 (GO): stations 1-8
Calibrated to bottle salts taken during
cruise.
Stations 1-7 were off by themselves
across a channel at the
south
end of the cruise track. Station 8
was between
the
coast and station 9. All 8 casts
were less than
140
db in depth, so a simple offset was applied to
Conductivity
in 4 groups of 1-3 casts. The
bottle-CTD
differences
were extremely inconsistent, as typical
for
shallow casts with high gradients.
The most
weight
was given to lowest-gradient areas; residual
salinity
differences have at least 2 near-0 values
for
all but station 1. Station 1 was
offset the same
as
station 2, based on past experience with the slow
drift
typically seen over the first few casts a
conductivity
sensor is used.
Conductivity
Sensor s/n UNKNOWN (GO?): station
113
Calibrated to bottle salts taken during
cruise.
This sensor had a large + Conductivity
drift with time during
the
cast, and it was only used once.
The upcast data
were
noisy, but needed for values reported with bottle
data. The down cast data clearly required a
different
correction
than the up cast.
1. A first-order dC(C) slope based on
bottle-CTD (up cast)
differences
was determined, then applied to both down
and
up cast CTD data.
2. Residual bottle-CTD (down cast)
Salinity differences were
visually
grabbed from a theta-salinity plot.
A
second-order
pressure-dependent fit (dS(P**2)) was
generated and
applied separately for down and up casts.
These
fits were applied IN ADDITION TO the dC(C) slope
determined
in step 1.
3. A deep Theta-Salinity overlay of
stations 113, 58 and 59
was
checked for consistency. Station
113 was positioned
between
stations 58 and 59.
CTD-5:
Pressure
Sensor s/n 77017 (Paine):
P Calibs:
May
1999 - 0.075/29.695 deg.C bath to
6080/1191 db
Oct.1999
- 0.1/28.85 deg.C bath to
6080/1191 db
cold cal: shifted -0.35/-0.5/-0.6 db
top 1000db/mid-range/4000db
from
pre- to post-cruise calibration
warm cal: shifted +0.3 top
1000db/mid-range and no change at bottom
Correction used: average pre-/post-cruise cold and warm
P calibs
(T2)
Temperature Sensor s/n 17534 (Rosemount PRT):
T Calibs: May 1999/Oct.1999
+0.0007 deg.C at 0 deg.C,
+0.0002 deg.C at 11 and 30 deg.C
from
pre- to post-cruise calibration
Correction used: equally weighted May + Dec. 1999 Tcals
(same #pts at each level,
same # of levels) - then averaged
(C2)
Conductivity Sensor s/n O24 (GO):
Calibrated to bottle salts taken during
cruises (HNRO7+KH36 used same
sensors for this CTD, Cond.
corrections determined in tandem)
1. For each cruise, generated
first-order dC(C) fits with a (4,2)
std.dev.
rejection using Bottle-CTD Cond. differences outside
the
high gradient areas (used pressures < 25 db or > 200 db).
This
omitted most of the high-gradient bottle-CTD scatter.
Also,
numerous KH36 casts were omitted from these fits because
their
down-up CTD differences were more than +/-0.0015 mS/cm.
2. An average of the coefficients for
HNRO7 and KH36 (from the dC(C)
fits
done in step 1) was applied to both data sets, then
residual
offsets were plotted and checked.
3. Offsets seemed to slowly but
steadily increase within each leg.
For
each cruise, generated and applied a first-order fit of
the
residual Conductivity offsets, using only differences
below
400db with a (4,2) std.dev. rejection.
Additionally,
a
few large bottle-CTD differences were manually omitted
from
these fits.
4. Offsets were then manually adjusted
from the smoothed values
based
on deep theta-salinity consistency.
Numerous Autosal
runs
were disregarded because of standardization issues caused
by
instrument problems and operator inexperience (frequent
standard
dial changes and drifts on many stations, espec. the
first
20 stations of KH36). If the CTD
data were consistent
before
adjustment, they were generally not shifted apart merely
to
match bottle data. Some data were
shifted due to down vs.
up
cast differences (down cast CTD data are reported, but
bottles
are compared to up cast CTD data at the time of the
bottle
trips.)
5. A residual pressure-dependent slope
was quite apparent at this
point. A first-order dC(P) fit was determined
for each cruise,
based
only on differences deeper than 250 db and using a (4,2)
std.dev.
rejection. (Thermocline and
surface bottles, often
also
in high gradients, distorted the fits, so only deeper
pressures
were used.)
6. The HNRO7 and KH36 dC(P)
coefficients from step 5 were averaged
together,
and then applied to CTD-5 data from both cruises.
The
dC(P) and dC(C) coefficients were both used, with the
two
Conductivity offsets added together.
7. Deep Theta-Salinity overlays of 8
consecutive casts, as well
as
non-consecutive stations in close proximity to each
other
based on position and/or depth, were checked for
consistency.
B.2. Salinity analyses: Carl
Mattson (SIO/ODF)
SALINOMETER TYPES SERIAL NUMBERS
Guildline 8400A Autosal 55-503
Guildline 8400A Autosal 48-263
WORMLEY standard water used:
Batch P-134
203 vials used
2 bad vials
Comments:
Autosals were configured for computer-aided
measurement. The data were acquired on a PC.
#48-263 stations 1-113 24 deg bath temp
B.3. Oxygen water sample
analyses: Carl Mattson and Ron Patrick (SIO/ODF)
Oxygens were run on all stations using a
Dosimat UV-endpoint detection automatic titration system.
Comments:
No major problems, hardly any problems.
The titrator employed a Brinkman Dosimat 665 automatic burette and an
Ultraviolet detection system interfaced with a PC for data acquisition and
control.
B.4. Nutrient analyses: Carl
Mattson and Doug Masten (SIO/ODF)
Nutrients were measured on all stations using
a Technicon AA-II CFA system with a PC based acquisition system. Nutrients
measured - NO2, NO3, PO4, SIO3.
Comments:
The system performed well with few problems.
Data were reviewed by analysts and transferred to the processing computer for
integration with other water sample data.
B.5. Chlorofluorocarbon
measurements: Mark Warner and DongHa Min (UW)
The measurement of chlorofluorocarbons, CFC-11
and CFC-12, in seawater and the overlying atmosphere during the JES expedition
(Hahnaro 7) were made using standard analytical techniques. The analysis was
based upon the purge-and-trap technique described by Bullister and Weiss (1988)
with a few modifications. The same volume of water for every sample was purged
through the use of a glass sample chamber with a calibrated volume. Ultra high
purity nitrogen (99.999% pure) was used as the carrier gas. (An analysis of the
CFC content found less than 1 part per trillion of both CFC-11 and CFC-12). A
Hewlett- Packard 5890-II gas chromatograph with electron capture detector was
used to detect the CFCs. The analog output (voltage) of the detector was
converted to a digital signal by a Hewlett-Packard 35900E and the digital
chromatograms analyzed on a Sun Sparcstation LX using software developed by Peter
Salameh for the AGAGE program. The results are reported on the SIO 1993 scale
using a calibrated standard gas cylinder (#39765).
Only minor analytical difficulties were
encountered during the cruise. The water sample is introduced into the sparging
chamber through the glass frit. After Station 8, the stripping chamber was
replaced due to the frit having become clogged with particles (probably from
previous measurements of estuarine waters with high sediment loads). This
greatly improved the flow through the stripping chamber and hence the
efficiency with which gases were sparged from the sample. The sensitivity of
the detector to an injection of a calibrated volume of the standard gas was
steady during the cruise with a standard deviation of +/-0.90% for CFC-12 and
+/-1.31% for CFC-11. Calibration curves were prepared while in port in Pusan
and additional points were added to the curves during the course of the
expedition. These additional points fitted the initial curve so that one
calibration curve could be used for the entire 23 days.
The CFC concentrations in approximately 1220
seawater samples were analyzed during the expedition. Samples were collected
from 111 of the 112 stations with the typical sampling strategy of alternating
casts with complete coverage of the water column (16 to 20 samples) and casts
where only 6 to 10 samples were collected at target depths (usually the bottom
or the East Sea Intermediate Water layer). Of these 1220 samples, approximately
40 were duplicates from the same Niskin to establish the measurement precision.
The shipboard measurements have been merged into the .SEA files. The precision
appears to meet or exceed WOCE standards (standard deviation of 1.5% or 0.005
pmol/kg, whichever is greater). Surface CFC concentrations are at or slightly
above the expected values based on Warner and Weiss (1985) solubilities. Since
there are CFCs throughout the entire water column, the typical method of using
the measured CFC concentrations in waters which should be CFC-free to estimate
the sampling blank cannot be applied. Instead, the results of a experiment
where CFC-free water in a Niskin, produced by bubbling nitrogen through the
sample, is allowed to sit. By measuring the change in CFC concentration with
time, the amount of contamination due to desorption can be estimated.
In preparation for the collection of samples
during the expedition of the Professor Khromov, seawater samples were also
collected in glass ampoules and flame-sealed for later analysis at the
University of Washington. Ampoule samples were collected from 137 bottles
immediately after the syringe sample for shipboard analysis was drawn. We plan
for the Russians to collect approximately 700 samples during the Khromov trip.
The comparison of the ampoules and shipboard measurements from this expedition
will be critical to our interpretation of the stored samples.
The atmospheric concentrations of the CFCs
were determined at 20 locations and times during the cruise. Air samples were
pumped from the bow through Decabon tubing to the analytical system. The
measured atmospheric concentrations of CFC-11 and CFC-12 both decreased with
increasing latitude. The mean and standard deviations for the atmospheric CFC
concentrations (in ppt) are:
CFC-11: 256.5 +/- 5.3
CFC-12: 538.8 +/- 8.3
CFC-113: 81.5 +/- 2.4
B.6. Alkalinity and pH: Pavel
Tischenko (POI) and Dong-Jin Kang (SNU)
B.6.a. Pacific Oceanological institute
(Pavel Tishchenko)
Samples were collected and analyzed for pH and
alkalinity from every station. The methods and results of a comparison with the
SNU system are described in B.6.c.
B.6.b. Seoul National University (Dong-Jin
Kang)
Samples were collected and analyzed from 15
stations for comparison with the POI analysis. The methods and results are
described in B.6.c.
B.6.c. Intercomparison of Alkalinity and pH
measurements between SNU and POI: Preliminary Report (Dong-Jin Kang and Pavel
Tischenko)
Introduction
The carbonate system in seawater is one of the
most complex topics in oceanography. More recently the fate of fossil fuel CO2
in the ocean has promoted interests in the study of carbonate chemistry in the
ocean. The biogeochemical cycle of CO2 in the ocean is controlled by
its special pumping mechanism such as solubility, biological, carbonate, and
dynamic pumps (Volk and Hoffer, 1985; Sarmiento et al., 1995). Among these
pumps, dynamic pump is strongly related with circulation and/or ventilation of
seawater. In order to quantify the dynamic pump, precise understanding the
distribution of CO2 parameters is essential.
Four CO2 parameters can be
measured, which are total dissolved inorganic carbon (CT), total
alkalinity (TA), fugacity of CO2 (fCO2), and
total hydrogen ion concentration (pH). These are used together with ancillary
information to obtain a complete description of the carbonate system in
seawater. It is only necessary to know two parameters from the four above to
have a complete description of the system (Park, 1969; Skirrow, 1975). TA and
pH are usually chosen since their procedures are simple to be carried out on
board.
There are several methods to determine TA and
pH in seawater. Methods for TA determination are single point titration,
open-cell potentiometric titration, closed-cell potentiometric titration,
colorimetric titration and so on. Potentiometric and spectrophotometric methods
are used for pH determination in seawater.
The potentiometric titration measuring EMF in
a closed cell ( Dickson, 1981; Bradshaw and Brewer, 1988; Millero et al., 1993;
DOE, 1994) and s pectrophotometry using an indicator dye are, in general,
accepted as modern analytical methods for the measurement of TA in seawater,
respectively. Although it is considered that these methods give accurate
information on the carbonate chemistry of seawater, those have some disadvantages
when those are carried out on board. As for pH, the spectrophotometric
performance of the instrument is not easy on board, which is one of the most
important factors for precise determination of pH (DOE, 1994). It takes long
time to analysis TA since the electrode needs times to adjust to changing EMF.
Seoul National University (SNU) uses
spectrophotometry and closed-cell potentiometric titration for pH and TA
measurements, respectively. The potentiometric pH measurement and direct
colorimetric titration for TA are used by Pacific Oceanological Institute
(POI).
On board intercomparison study was carried out
during the Hahnaro-7 expedition on the East/Japan Sea. Around 130 seawater
samples from surface to more than 3000 m depth were analyzed by both methods.
The preliminary results are reported in here.
Methods and Materials
Total Hydrogen Ion Concentration (pH)
SNU used spectrophotometry using m-cresol
purple as an indicator dye (Clayton and Byrn, 1993). The absorbances of
seawater and sea water with dye are measured at three wavelengths (434, 578,
and 730 nm) which are corresponding to the absorption maxima of acid (434 nm)
and base (578 nm) forms of the dye and a non-absorbing wavelength (730 nm). The
pH values are calculated from the absorbance of seawater and seawater + dye at
three wavelength using the following equation.
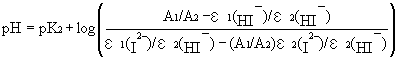
A1 and A2 are the
corrected absorbances measured at the wavelengths of 578 and 434 nm,
respectively. pK2 is the acid dissociation constant for the species
HI- which is a function of salinity and temperature (in K);
![]()
The various extinction coefficient ratios for m-cresol purple are as
follows:
epsilon1(HI-)/ epsilon2(HI-) = 0.0069
epsilon1(I2-)/
epsilon2(HI-) = 2.222
epsilon2(I2-)/
epsilon2(HI-) = 0.133
All SNU data reported here are averaged value
of duplicate analysis. The average precision of duplicate analysis is 0.006 pH
unit is one standard deviation.
POI used potentiometric measurement in a
potential cell without liquid junction for pH measurements of seawater, since
it was reported that unreproducibility and loss of accuracy of potentiometric
pH measurement are caused by liquid junction potential (Tishchenko and Pavlova,
1999).
|
Glass-electrode-Na+ |
Test (standard) solution |
H+-glass-electrode |
(A) |
The
cell (A) was calibrated by T RIS-buffer (DelValls and Dickson, 1998) at 25 oC
and pH is calculated by formula:
![]()
where
E, mNa, and g Na are EMF, sodium ion molality and
activity coefficient of sodium ion, respectively; subscript indices s, x denote
standard and test solutions, respectively. Activity coefficients of sodium ion
have been calculated by Pitzer method (Pitzer, 1992) and approximated by
empirical formula below.
Properties
of sodium ion as follows
(mNa)s
= 0.44618
(g
Na)s = 0.6412
![]()
![]()
![]()
where S is salinity; I is an ionic strength
which calculated by equation
![]()
Shift of a standard EMF of the cell (A) was
less then 0.5 mV/ per day. The precision of pH measurement by means of the cell
(A) is about ± 0.004 pH unit.
Total Alkalinity (TA)
SNU used potentiometric titration measuring
EMF in a completely closed cell (Millero et al., 1993). The system is composed
by a motor driven piston burette (5 mL, scale ± 0.01 mL) with
anti-diffusion tip, titration cell assembly, and personal 0.02 computer for
controlling burette and data acquisition from pH meter. Orion double junction
Ag/AgCl reference electrode and ROSS glass electrode are used as reference and
EMF electrodes, respectively. The titration cell and burette piston are inco
rporated with outer water jackets which constant temperature (25.0 +- 0.1C)
water circulates through. The titration procedure is controlled by personal
computer through serial ports. Total alkalinity is calculated by non-linear
least squares approach method (Dickson, 1981; Johansson and Wedborg, 1982; DOE,
1994).
Total alkalinity is normalized by Dicksons
CRMs (Batch #46) which are measured at every station. It take 40 to 50 minutes
to complete titration including flushing. The average precision of duplicate
analysis is 4.5 umol kg-1 in one standad deviation.
POI used Bruevich's Method. In Russia a
determination of total alkalinity is direct colorimetric titration by
hydrochloric acid in an open system using a mixed indicator (methylene blue and
methyl red). The titration is carried out under flow of CO2-free air
(or nitrogen). The change of the sample color from green to light-pink at the
equivalence point is detected by visually. The pH at the end point is about
5.4-5.5. The method is well-known as Bruevich's method (Bruevich, 1944) and
recommended as standard operating procedure among Russian oceanographers (The
methods..., 1978). The titration procedure is presented below.
The acid (~0.03 N) is standardized
daily with Dickson's CRM. The calibrated 0.04 volumetric pipette (25 mL) is
used. Twenty-five milliliters of the primary standard is placed in a titration
cell. Three drops of the mixed indicator are added and the sample is flushed
with nitrogen for 3 min to remove all the carbon dioxide. CRM is then titrated
with hydrochloric acid using Dosimat 665 motor driven piston burette (5 mL,
scale ±
0.01 mL). The equivalence point of the titration is determined 0.02
colorimetrically. The solution color at the end point of the titration must be
light pink and quite stable (no change for 1 min). Seawater samples are
analyzed using the same procedure. Total titration time takes about 7 min.
Alkalinity is calculated by formula
TA=NaVa/(Vsw dsw)
Here, Na, and Va, are normality and
volume of acid, respectively; Vsw and dsw are volume and density
of seawater. Estimated precision is about 0.2% (4 ~ 5 umol kg-1).
The both methods are summarized briefly in
Table 1.
Table 1. Summary of
the methods for total alkalinity (TA) and pH by Seoul National University (SNU)
and Pacific Oceanography Institute (POI)
|
|
|
SNU |
POI |
|
TA |
Cell
type |
Closed |
Open |
|
End
Pt detection |
EMF |
Visual
Indicator |
|
|
Calculation |
Non-linear
Least Square < /TD> |
Algebraic
formula |
|
|
Acid |
~
0.25 N HCl |
~
0.02 N HCl |
|
|
Acid
Std. |
Na2CO3
and CRM |
Na2CO3
and CRM |
|
|
Precision |
4.5 umol kg-1 |
4 ~ 5 umol kg-1 |
|
|
PH |
|
Spectrophotometry Using
mCP |
EMF Without
liquid junction |
|
Precision |
0.006 |
0.004 |
Materials
During
the Hahnaro-7 expedition in the East(Japan) Sea from 24th June to 17th
July, 1999, around 130 real seawater samples from the surface to more than 3500
m depth at 12 stations were used for intercomparison (Table 2).
Table 2. Locations, water depth (in
meters), and number of samples of each station for intercomparison of total
alkalinity and pH measurements between SNU and POI.
|
Sta. # |
Latitude |
Longitude |
Depth |
No. of Samples |
|
4 |
34 49.9 N |
130 11.9 E |
124 |
7 |
|
13 |
36 12.0 N |
132 27.6 E |
1074 |
10 |
|
26 |
37 3.45 N |
130 56.2 E |
2207 |
7 |
|
41 |
37 53.7 N |
129 44.1 E |
1626 |
8 |
|
45 |
37 53.8 N |
132 41.8 E |
2530 |
11 |
|
57 |
40 50.0 N |
134 00.0 E |
3530 |
13 |
|
58 |
41 10.0 N |
136 20.0 E |
3450 |
13 |
|
72 |
37 11.0 N |
135 32.1 E |
1739 |
13 |
|
77 |
38 38.0 N |
136 00.0 E |
2725 |
12 |
|
80 |
39 59.8 |
138 00.1 E |
2420 |
11 |
|
95 |
42 0.00 N |
138 00.0 E |
3585 |
13 |
|
108 |
43 47 N |
138 50 E |
2970 |
? |
Results
Total Hydrogen Ion Concentration (pH). The pH values of two
laboratories are in a good agreement (Fig. 1). However, the slope between two
data sets is about 5 % greater than equivalence (pHPOI = 1.056 x pHSNU
- 0.479, r2=0.991). The differences between two are almost within 0
+- 0.1 when pH value is higher than 7.8 with some exceptions. While, in the
case of smaller pH values than 7.8, the differences increase linearly as pH
values decrease. It becomes about 0.35 at pH value of 7.5 (Fig. 2). This
difference (0.35) is not negligible compared with precisions of both methods
(0.004 ~ 0.006). Since typical profile of pH in the region (East/Japan Sea) shows
around 7.5 of pH from 200 ~ 300 m depth to the bottom (Fig. 3), it can be said
that there are differences in vertical distributions between two methods. The
reason of the difference is to be studied carefully in the future.
Total Alkalinity (TA). Normalized total
alkalinity (NTA = TA x 35/S; S represents salinity) values of two laboratories
show linear relationship, in general. How ever, it is seemed that there is a
systematic difference between two methods (Fig. 4). POI values (open cell) are
smaller to about 5 ~ 10 umol kg-1 than SNU values (closed cell). In
the PICES WG13 intercomparison workshop, which was held at Tsukuba, Japan in
April, 1999, the closed system shows higher values and open system shows lower
than mean values for samples of high pCO2 concentration. This study
gives coincident results with those of the PICES intercomparison workshop.
The differences between two methods increase
as NTA increases until NTA reaches around 2330 ~ 2340 umol kg-1, and
then it can be said that the differences keep constant in the range of NTA
higher than 2340 umol kg-1 (Fig. 5). From the vertical profiles, NTA
of this range is found within 100 and 500 m (Fig. 3), which is similar with the
depth which shows constant pH differences.
The causes of the differences between two
methods will be studied carefully in the future.
References
Bruevich C.V. 1944. Determination alkalinity
of small volumes of seawater by direct titration. In: Instruction of chemical
investigation of seawater. Glavsevmorput, M.-L., 83p.
Clayton, T.D. and R.H. Byrn, 1993.
Spectrophotometric seawater pH measurements: total hydrogen ion concentration
scale calibration of m-cresol peurple and at-sea results. Deep-Sea Res., 40:
2115-2129.
DOE, 1994. Handbook of methods for the
analysis of the various parameters of the carbon dioxide system in sea water.
Version 2, A.G. Dickson and C. Goyet eds., ORNL/CDIAC-74
Dickson, A.G., 1981. An exact definition of
total alkalinity and a procedure for the estimation of alkalinity and total
inorganic carbon from titration data. Deep-Sea Res., 28A; 609-623.
Ivanenkov V., O, Bordovsky, 1978. The methods
of hydrochemical investigation of the ocean. 271p. Nauka, Moscow, (in Russian).
Johansson, O. and M. Wedborg, 1982. On the
evaluation of potentiometric titrations of seawater with hydrochloric acid.
Oceanol. Acta, 5: 209- 218.
Millero, F.J., J.-Z. Zhang, K. Lee, and D.M.
Campbell, 1993. Titration alkalinity of seawater. Mar. Chem., 44: 153-166.
Park, K., 1969. Oceanic CO2 system:
an evaluation of ten methods of investigation. Limnol. Oceanogr., 14: 179-186.
Pitzer K.S. Ion interaction approach: Theory
and data correlation.// Activity coefficients in electrolyte solutions. 2nd
Edition/ K.S.Pitzer Ed. Roca Raton Ann Arbor Boston London: CRC Press, 1991.
p.75-153.
Sarmiento, J.L., R. Murnane, and C.Le.Quere,
1995. Air-sea CO 2 transfer and the carbon budget of the North
Atlantic. Phil. Trans. R. Soc. Lond. B, 348: 211-219.
Skirrow, G., 1975. The dissolved gases-carbon
dioxide. In Chemical Oceanography, v. 2, J.P. Riley and G. Skirrow eds., 1-912.
Tishchenko P.Ya. and G. Yu. Pavlova, 1999.
Standardization of pH measurements of seawater by Pitzer's method. In: CO2
in the Oceans, Extended Abstracts, Tsukuba.
Volk, T. and M.I. Hoffert, 1985. Ocean carbon
pumps: Analysis of relative strength and efficiencies in ocean-driven
atmospheric CO2 changes. In The carbon cycle and atmospheric CO2:
natural variations archean to present, E.T. Sundquist and W.S. Broecker eds.,
99-110.
Figures (SNU)
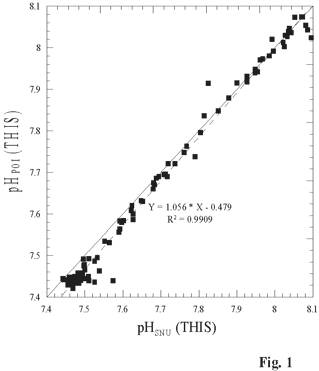
Figure 1. A plot of pH values from SNU and POI. The units are in total
hydrogen ion scale (THIS).
Figure 2. A plot of pH differences between two methods vs. pH values of SNU.
The units are same as Fig. 1.
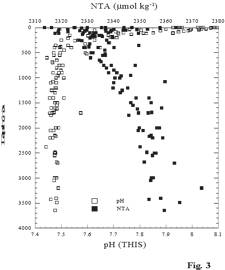
Figure 3. Vertical distributions of pH and normalized total alkalinity (NTA)
for all stations. The units of NTA are in umol kg-1. The depths are
from the wire out data.
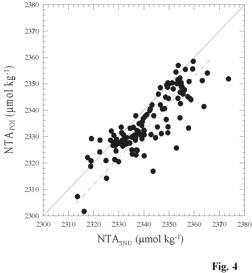
Figure 4. A plot of normalized total alkalinity (NTA) values from SNU and
POI. The units are same as Fig. 3.
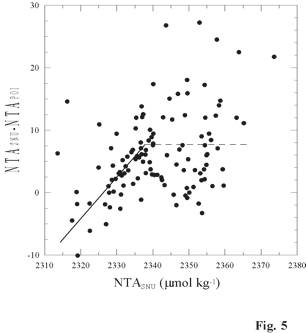
Figure 5. A plot of NTA differences between two methods vs. NTA values of
SNU. The units are same as Fig. 3.
B.7. Noble Gas and Tritium
Sampling: Clare Postlethwaite (SOC)
280 water samples from 22 stations, located
mainly in the deepest parts of the basins and also in the straits, were
collected for noble gas and tritium analysis. Water samples were collected from
the rosette in 15mm diameter copper tube for analysis of helium, neon, argon
and possibly krypton and xenon. The copper tube was cold sealed and the samples
were packed safely for later analysis. All noble gas samples were collected in
duplicate and several samples were collected in quadruplicate. The noble gas
measurements will help to quantify the influence that the seasonal sea ice in
the Tatarskiy Strait has on water mass formation in the Japan/East Sea.
Samples for tritium analysis were collected
concurrently to the noble gas samples so that tritium/helium dating is
possible. These samples were collected in one litre glass bottles that had been
pretreated by heating to 200 degrees centigrade in an argon atmosphere. During
sampling the bottles were not rinsed and a head space was left. These samples
were also packed for later analysis at the Noble Gas Laboratory at the
University of Southampton, U.K.
B.8. Oxygen Isotope Sampling:
Clare Postlethwaite (SOC)
100 water samples from 11 stations were
collected in 300ml glass bottles for the analysis of oxygen isotopes. The glass
bottles had been treated in the same way as those for tritium analysis. The
stations chosen for the noble gas and tritium analysis as the volumes of water
taken in the samples may be sufficient to allow both tritium and oxygen isotope
analysis from both the 1 litre and 300 ml bottles thereby providing more data.
B.9. Other SNU sampling (helium,
tritium, D-14, Del 18O, SF6): Dong-Jin Kang (SNU)
Samples for other tracers were collected for SNU. The numbers of stations for each tracer are 9 for helium and tritium, 6 for C-14, 23 for Del 18O of water, and 1 for SF6. All of these will be measured in the laboratory. Helium and tritium will be determined by noble gas mass spectrometer after series of pretreatment. C-14 will be measured by Accelerating Mass Spectrometer from CO2 extracted in seawater. Del 18O will be analyzed using stable isotope ratio mass spectrometer. SF6 will be measured by GC/ECD.
B.10. Underway pCO2
measurements: Dong-Jin Kang, Doshik Hahm (SNU)
B.11. Acoustic doppler current
profiling (ADCP): Lynne Talley (SIO) and Peter Hacker (U. Hawaii)
A 150 KHz RD Instruments acoustic doppler
current profiler was integrated with the CTD/rosette package. The LADCP makes
direct current measurements at the depth of the CTD, thus providing a full
profile of velocity. The LADCP was used at every station. The shipboard data
acquisition system for the LADCP permits data acquisition on a laptop PC and
very preliminary processing on a small Sparc workstation. When the data set is
returned to SIO and the U. of Hawaii, preliminary processing will determine if
the data set is useful for processing. Criteria include the presence of
scatterers in the water column and good data profiles. Assuming that the data
set is useful, data processing will be carried out by Scripps and U. Hawaii
researchers. Preliminary profiles
plotted from the LADCP at sea indicate that the data set looks promising and
useful. (Talley group at SIO; Hacker/Firing group at U. Hawaii).
ADCP data were recorded by the Revelle
computer system. Rudimentary processing was carried out during the cruise to
ensure that data files were complete. Preliminary checks suggest that no data
were recorded for the interval between CTD stations 57 and 58.
B.12. Meteorology: R/V Revelle
(Talley; SIO)
IMET data were recorded at 30 sec intervals
on the ship's underway system.
Final data can be accessed from website of Robert Beardsley and Richard
Limeburner http://www.whoi.edu/science/PO/japan_sea, under
Ship-based Met Measurements.
Sensors: Air Temp, RH, Barometric pressure,
SWR, LWR, Precipitation, Wind Speed/Direction, Sea Surface
Temperature/Conductivity. Data merged with Ships navigation, gyro and time
server.
B.13. Navigation: R/V Revelle
(Talley; SIO)
Navigation was recorded from both a P-code
GPS and an Ashtech GPS. The P-code recorded data were corrupted for the period
July 7, 1999 at 1043 to July 7, 1999 at 2356. Positions were restored from the
Ashtech GPS for this period for the data file that was distributed at the
conclusion of the cruise. There was apparently no problem with the real-time
positions displayed on the bridge and in the lab, and so the station positions
are correct.
B.14. Bathymetry: R/V Revelle
(Talley; SIO)
Underway bathymetry from the center return of
the Revelle's Seabeam was recorded and stored for use with the vertical
sections. Bathymetry from the Knudsen echosounder was also recorded, and was
used to restore portions of the Seabeam bathymetry which were not recorded.
These include the Tsushima Strait section (stations 1 to 7) and the segment
between stations 27 and 29, at times 990629 0453, June 29 to 0939, June 29. The
Knudsen echosounder also was not functioning for a portion of the missing
Tsushima Strait section and so detailed underway bathymetry is not available
for this portion.
B.15. Video Plankton Recorder
(VPR): Carin Ashjian (WHOI)
We described aspects of the biological
oceanography of the Japan/East Sea, in particular how plankton communities and
abundances changed in the different hydrographic regimes. Our research had
three primary objectives: 1) To characterize the zooplankton community of the
Japan Sea in terms of taxonomic composition and size structure, 2) To
characterize the scales of variability of the zooplankton over distances from
centimeters to hundreds of kilometers, and 3) to determine the relationship
between zooplankton taxa and associated environmental variables over scales
from centimeters to hundreds of kilometers. To achieve these goals, we
conducted a survey of the southern Japan Sea using the Video Plankton Recorder.
The Video Plankton Recorder (VPR) is essentially an underwater microscope which
images plankton at two different magnifications. The instrument is mounted on a
V-fin which was towed behind the ship, undulating between the surface and a
selected depth. Video images and associated hydrographic and biological data
are transmitted from the towed vehicle to the ship via fiber optic cable.
In-focus images of plankton are extracted from the video and identified to taxa
in real time. Plankton abundances and hydrography are plotted in real time.
During the survey of the JES, we towed the
VPR at ~9 knots between all CTD stations along the transect lines. We sampled
over a total distance of 356 2 kilometers and collected and processed over 240
hours of video and associated data. The instrument sampled between near surface
and 80 m for much of the survey with an inter- profile distance of ~7
kilometers.
In addition to the plankton images, we
collected pressure, temperature, conductivity, fluorescence, light
transmission, and ambient light data as well as logging P-Code GPS position and
time (UTC) and Knudsen Echo Sounder depth. Real-time plots of hydrographic (T,
S, density) and biological (fluorescence, light transmission, unidentified
copepods, diatom chains, and Oithona) showed strong vertical structure in
plankton distributions that were associated with the physical environment
(e.g., thermocline) and regional differences in the type and abundance of
plankton.
Future analyses will include: 1) describing
the size distribution of taxa, 2) quantifying associations between different
taxa and between taxa and environmental conditions, 3) examining the scale of
variability of the distributions of zooplankton taxa, and4) incorporating
instantaneous velocity measurements collected with the shipboard acoustic
Doppler current profiler to estimate of flux of plankton between different
hydrographic regions and in and out of the JES.
B.16. Plankton net tows: Carin
Ashjian and Cabell Davis (WHOI)
We conducted 15 plankton tows using a 1-m2 (mouth area), 150 B5m mesh ring net towed obliquely between the surface and 80 m. Initial inspection of the samples indicated strong variation in taxonomic composition between the different regions. The plankton samples assisted us in identifying exotic taxa that were seen in the video images.
B.17.
Bio-optical studies: Greg Mitchell (SIO)
There are three primary goals of the work:
1. Calibration and validation of SeaWiFS
Ocean Color satellite. Above water spectral reflectance and atmospheric optical
depth was collected with a SIMBAD hand-held radiometer during day-time CTD
profiles. The SIMBAD views the ocean surface from above, and the direct beam of
the sun to derive spectral reflectance. This above-water optics was supported
by water samples including preparations for chlorophyll a, HPLC pigments,
absorption by particles and soluble material, particulate organic carbon and
inorganic minerals.
2. Parameterizations of ocean attenuation and
chlorophyll specific absorption for ocean photosynthesis models. Samples were
collected within the euphotic zone, as determined by Secchi Depth, to
characterize both particle and soluble absorption coefficients. The particulate
material was partitioned to phytoplankton and detrital components using
methanol extraction and difference spectroscopy. Chlorophyll-specific
phytoplankton absorption coefficients will be used for photosynthesis models.
The total particle and soluble absorption will be used to model spectral
attenuation coefficients of the euphotic zone.
3. Application of beam attenuation
coefficient as an augmentation to CTD hydrographic profiles for determining
water mass structure and circulation. Red and blue wavelength beam attenuation
meters (transmissometers) are integrated with the SIO CTD system and data were
collected for all CTD profiles. Water samples through out the full depth of the
profiles were collected from selected stations and selected depths to
characterize particulate organic carbon, particle and soluble absorption, and
presence of different mineral components. Attenuation coefficients will be
correlated to vertical structure in hydrographic parameters including oxygen,
nutrients, salinity and temperature.
Typical station plan Water from the CTD
Rosette system was collected for the surface and selected depths for selected
stations (usually daytime only stations to support SIMBAD and SeaWiFS). Water
was prepared by vacuum filtration in the lab. Absorption samples were analyzed
on the ship. Other samples have been stored in liquid nitrogen for return
shipment to SIO for analysis.. Mineral optics water samples were preserved with
glutaraldehyde in glass bottles for return shipment to SIO.
Equipment
Wet Labs Cstar beam attenuation meter (red)
CST-245DR
Wet Labs Cstar beam attenuation meter (blue) CST-244DB
Varian Cary 1E UV/Visible spectrophotometer 95061306
Univ. Lille SIMBAD ocean reflectance radiometer 972308
C. Distribution of data and
samples to groups other than originating principal investigators
CTD data: Pavel Tischenko (POI), Vladimir Luchin (FERHRI) (7/18/99)
Water sample data (salinity, oxygen nutrients,
CFCs, alkalinity, pH): Pavel Tischenko (POI), Vladimir Luchin (FERHRI), Lynne
Talley (SIO), Mark Warner (UW), DongHa Min (UW), Clare Postlethwaite (SOC),
Dong-Jin Kang (SNU) (7/18/99)
Lowered ADCP data: Pavel Tischenko (POI),
Vladimir Luchin (FERHRI) (7/18/99)
Underway meteorology (IMET) and surface
temperature/conductivity, bathymetry, navigation: Pavel Tischenko (POI),
Vladimir Luchin (FERHRI), Carin Ashjian (WHOI), Dong-Jin Kang (7/18/99)
Underway ADCP data: Carin Ashjian (WHOI)
(7/18/99)
pCO2 data: to be processed and distributable by
1/1/00.
Appendix A: CTD data quality comments
## HNRO7 notes:
071/02 hit bottom after bottle trip; truncated
pseq data before hit
076/01 stopped approx. 2650m down to clear
fouled Csensor: brought back up approx 50m
(bad data started at 2606db, reversed at 2680db/back to
2619db, then down)
solution: cut out
original/fouled section and reverse/up part of yoyo
included un-fouled second down. Data missing from yoyo-back segment
(2606-2618db) filled by interpolation during pressure
sequencing.
## Pressure levels
interpolated (missing data, or omitted instabilities at surface):
004/01 40 db
007/01 0 db
009/02 0 db
012/02 0 db
015/01 0 db
016/02 0 db
018/01 0 db
029/01 0 db
030/01 0 db
031/01 0 db
048/01 0 db
051/01 0 db
076/01 26-28,2606-2618 db
087/02 32 db
093/01 0,16-22 db
095/01 16 db
096/01 0 db
097/01 14-18 db
098/02 0 db
101/01 28-38 db
108/01 18 db
110/02 18-20 db
111/01 22-24 db
112/01 0,18 db
113/01 0,20-22 db
113 casts/49 levels interpolated
## Conductivity
offsets: OC = Offset Conductivity
025/01 0-2176 db #OC +0.005 mS/cm ## maxp = 2178
030/01 1350-1378 db #OC +0.0015 mS/cm ## maxp = 2352
033/02 1606-1610 db #OC +0.003 mS/cm
033/02 1606-1614 db #OC +0.002 mS/cm
033/02 1606-1642 db #OC +0.0015 mS/cm
033/02 1606-1732 db #OC +0.0015 mS/cm ## maxp = 2180
052/01 500-546 db #OC
+0.0045 mS/cm ##
maxp = 546
057/01 0-1520 db #OC -0.001 mS/cm ## maxp = 3530
065/01 1202-1238 db #OC +0.0005 mS/cm
065/01 1202-1288 db #OC +0.0005 mS/cm
065/01 1202-1500 db #OC +0.0085 mS/cm ## maxp = 2262
083/01 1462-1492 db #OC +0.0005 mS/cm
083/01 1462-1624 db #OC +0.0005 mS/cm ## maxp = 1624
093/01 876-914 db #OC
-0.0005 mS/cm
093/01 916-974 db #OC
+0.0005 mS/cm ##
maxp = 3676
094/02 0-1772 db #OC -0.0015 mS/cm ## maxp = 3694
097/01 1742-3630 db #OC +0.0005 mS/cm ## maxp = 3630
098/02 332-628 db #OC
-0.001 mS/cm ##
maxp = 3324
104/01 0-1328 db #OC +0.004 mS/cm ## maxp = 1328
105/01 1400-1454 db #OC +0.001 mS/cm ## maxp = 2142
106/02 0-800 db #OC
+0.0025 mS/cm
106/02 0-2610 db #OC
+0.0055 mS/cm ##
maxp = 2610
## winch stops/yoyos on
down casts (not at surface or bottom of cast):
(stas 65 and 76 yoyos to
clear fouled Conductivity sensor)
065/01 11 db yoyo (1501 back to 1490 db down; 3.5
mins.) ## maxp = 2262
076/01 60 db yoyo (2680 back to 2619 db down; 4.8
mins.) ## maxp = 2994
108/01 stop 1 min. at 324-328 db ##
maxp = 3474
Appendix
B: Bottle data quality comments
Japan East Sea
Summer 1999
R/V Roger Revelle HNRO7
Bottle data quality
comments
Contact: Lynne D. Talley ltalley@ucsd.edu
-----------
Bottle Quality Comments
Remarks for deleted
samples, missing samples, PI
data com-
ments, and WOCE codes other than 2 from HNRO7 (HAHNARO Leg
7). Investigation of data may include
comparison of bottle
salinity and oxygen data
with CTD data, review of data plots
of the station profile and
adjoining stations, and rereading
of charts (i.e., nutrients). Comments from the Sample Logs
and the results of ODF's
investigations are included in this
report. Units stated in these comments
are degrees Celsius
for temperature, Practical
Salinity Units for salinity, and
unless otherwise noted,
milliliters per liter for oxygen and
micromoles per liter
for Silicate, Nitrate, Nitrite, and
Phosphate. The first number before the
comment is the cast
number (CASTNO) times 100
plus the bottle number (BTLNBR).
Station 001
Cast 1
CTD oxygen very noisy.
CTD salinity spikes
in strong T gradient. Autosal bad, switched
after run.
107
Delta-C at 14db is 0.0262. Salinity is
33.769. Sample from gradient
area, salt
analysis looks ok.
102
Sample Log: "NB2, air leak
before venting."
Salt analysis required 4 attempts. Delta-C
at 100db is 0.022. Footnote questionable.
Station 002
Cast 1
New CTD oxygen sensor installed
before sta-
tion. CTD: salinity spikes. Autosal
bad,
switched after run.
107
Salt analysis required 4
attempts; Using
first value only. Delta-C at 33db is .0053.
106
Salt much too high, delete value (qflg=4)
ldt. Original salt
data deleted, not backed
up in ORIG directory.
104
Salt analysis required 4
attempts; Using
first value only. Delta-C
at 89db is
-0.0005.
101
Salt too high, in gradient, suspicious (qflg
= 3) ldt. Delta-C at 132db
is 0.0743. Salin-
ity is 34.401.
Station 003
107
Salt low, in gradient, probably
OK (qflg=2)
ldt. Delta-C at 28db is
-0.0275. Salinity is
33.997. Salt analysis ok.
106 Salt high, in
gradient, probably OK (qflg =
2) ldt. Salt analysis required 4 attempts;
value seems high.
105
Salt too low (in constant S layer) (qflg = 4)
ldt. Delta-C at 58db is
-0.0942. Salinity is
34.223.
104
Delta-C at 78db is
-0.0398. Salinity is
34.311. Salt analysis ok.
Station 005
106
Salt high, but in gradient,
OK (qflg=2) ldt.
105
Delta-C at 72db is -0.0575. Salinity is
34.406. Salt too low, should be like 104 &
103. No notes. (qflg=4) ldt.
102
Salt sample drawn, but not analyzed. Oxygen
high by ~0.13ml/L; no notes; no feature in
other parameters
Station 006
Cast 1
Samples were only drawn for Bio-optics. Dou-
ble samples collected for Mitchell First sam-
ple fired well above bottom
217
Samples were only drawn for Bio-optics.
214
O2 data sheet: "Oxy contaminated water, would
not titrate." Delta-C at 13db is -0.0277.
Salinity is 34.221. Salt
analysis ok. Sam-
ple from gradient area.
215
Samples were only drawn for Bio-optics.
213
Samples were only drawn for Bio-optics.
212
Salt low, but in gradient, OK (qflg=2) ldt.
Delta-C at 28db is
-0.0462. Salinity is
34.407.
211
Samples were only drawn for Bio-optics.
209
Samples were only drawn for Bio-optics.
207
Samples were only drawn for Bio-optics.
205
Samples were only drawn for Bio-optics.
203
Samples were only drawn for Bio-optics.
201
Oxygen 0.02-0.03 higher than 202 & 204; no
feature in other parameters for these bottles
which are same.
Station 007
106
Salt high, in gradient,
probably OK (qflg=2)
ldt.
105 Salt low, in
gradient, probably OK (qflg=2)
ldt. Delta-C at 38db is
-0.1277. Salinity is
34.374. Salt analysis ok.
103
Oxygen high by ~0.03ml/L vs other bottles at
same theta; no feature in other parameters
Station 008
111
O-ring not seated properly."
Sample Log:
"Bottle 11 air leak prior to venting,
110
Delta-C at 14db is 0.0509. Salinity is
33.758. Salt analysis
ok. Sample in gradi-
ent area.
106
Delta-C at 65db is
-0.0871. Salinity is
34.361. Salt analysis
ok. Sample in gradi-
ent area.
105
Delta-C at 75db is
-0.0313. Salinity is
34.234. Salt analysis ok. Sample in gradi-
ent area.
102
Salt analysis required 4
attempts. Using
first value only. Delta-C
at 104db is
0.0320. Salinity is 34.082.
Station 009
Cast 1
CTD: conductivity failed at about 270 m down-
cast. Cast aborted. CTD:
cracked conductivi-
ty sensor.
220
Delta-C at 2db is 0.4997. Salinity is 34.148.
Salt analysis ok.
219 Delta-C at 15db is 0.1506. Salinity is
34.148. Salt analysis ok.
215
Delta-C at 106db is 0.1348. Salinity is
34.358. Salt analysis
ok. Sample from gra-
dient area.
213
Delta-C at
151db is 0.0238. Sample from gra-
dient area. Salt analysis
ok.
Station 010
124
Sample Log: "Bottle 24
leaker (when stopcock
pushed in & vent closed)."
109
Delta-C at 755db is -0.1446.
Salinity is
33.880.
Analytical problems, sample reran
per log.
108
Delta-C at 856db is -0.1417.
Salinity is
33.883.
Analytical problems, sample reran
per log.
Station 011
223
Samples were only drawn for Bio-optics. Er-
ror was made with nutrient sample numbers.
Duplicate samples were drawn from 24, but one
was assigned to 23. Nutrient values deleted
from
NB23
221
Samples were only drawn for Bio-optics.
220
Delta-C at 55db is
-0.0693. Salinity is
34.294. Salt analysis
ok. Sample taken from
gradient area.
219
Samples were only drawn for Bio-optics.
Station 012
219
Samples were only drawn for Bio-optics. Er-
ror was made with nutrient sample numbers.
Duplicate samples were drawn from 20, but one
was assigned to 19. Nutrient values deleted
from NB19
218
Oxygen high; no notes; no
feature in other
parameters.
217
Delta-C at 55db is 0.0359. Salinity is
34.289. Salt analysis ok.
Overlays well w/
same depth from Sta. 011.
Station 013
117
Delta-C at 29db is
-0.0691. Salinity is
34.303. Salt analysis ok.
Sample from gradi-
ent area.
116
Delta-C at 69db is -0.0229.
Salt analysis
ok. Sample from gradient area.
113
Delta-C at 130db is 0.0358. Salinity is
34.260. Salt analysis ok.
Sample from gradi-
ent area.
105
Delta-C at 755 db is 0.0038, in
non-gradient
area.
Station 014
108
Oxygen looks high by ~0.03ml/L vs other pa-
rameters and CTDO trace; no notes Delta-C at
24db is 0.0474. Salinity is 34.099. Sample
taken in gradient area.
Similar feature in
sta. 016 at same depth.
104
Delta-C at 144db is 0.0775. Salinity is
34.154. Sample taken in
gradient area. Simi-
lar feature in Station 016 at same depth.
Station 015
108
Corrected trip file 8 was reported as 7.
Shipboard processing did not update .bot
file.
107
Corrected trip file 7 was reported as 6.
Shipboard processing did not update .bot
file.
106
DLOG - missed trip at 43.9dbar, values from
.scr
105
Delta-C is -.0229. Salt
analysis ok.
Station 016
Cast 2
CTD: cast 1 optics. Some double
samples for
optics. CTD: 01602.bot only
23 trips. Dupli-
cated surface trip values for 23 + 24 in h00
file.
223
Samples were only drawn for Bio-optics.
Error was made with nutrient sample numbers.
Duplicate samples were drawn from 24, but one
was assigned to 23.
Nutrient values deleted
from NB23 Sample Log: "Optic samplers found
N23 had smaller water volume than N19 and N21
for this cast and a previous cast for which
the sampler completely drained
the untapped
19, 21, and 23."
Possibly tripped in the
air?
221
Samples were only drawn for Bio-optics.
219
Samples were only drawn for Bio-optics.
202
Delta-C is 0.0031,in non-gradient area. Salt
analysis ok. Overlays well w/ sta. 017&019
vs. theta.
Station 017
223
Samples were only drawn for Bio-optics. Er-
ror was made with nutrient sample numbers.
Duplicate samples were drawn from 24, but one
was assigned to 23 and the
other deleted.
Nutrient values deleted from NB23 & reas-
signed to NB24
221
Delta-C is -0.0177. Sample
from gradient
area. Salt analysis ok.
000110 SRA
220
Sample Log: "Bottle 20 spigot
pushed in on
boarding." CTD: only 23 trips. need to dup
surface. Delta-C at 88db is
0.0262. Salinity
is 34.140. Salt analysis
ok. Value overlays
well w/ sta. 016 (vs theta). Salt
sample
taken in gradient.
209 Delta-C at 945db is 0.0537. Salinity is
34.067. Salt analysis ok. Value overlays
well w/ sta. 016&018. Salt sample taken in
gradient. 000110 SRA.
Station 018
123
Delta-C at 28db is 0.0256. Salinity is
34.168. Salt analysis
ok. Sample from gra-
dient area.
122
Delta-C is -0.019. Salt
analysis ok. Salt
sample from gradient area.
121
Salt analysis required 3
attempts, using
first value only. Delta-C
at 88db is 0.024.
Sample from gradient area.
Station 019
123
Oxygen looks high vs other parameters and CT-
DO
122
Delta-C at 48db is
-0.0467. Salinity is
34.392. Salt analysis
ok. Sample from gra-
dient area.
121
Oxygen looks high vs other parameters and
CTDO. Salt analysis required 5
attempts.
Delta-C is
-.0063. Sample overlays well with
Sta. 018 value from same
theta and pressure.
120
Oxygen looks like duplicate of 119 and looks
low vs other parameters and CTDO Delta-C at
149db is -.0243. Salt analysis ok.
Salt sam-
ple from gradient area.
Station 020
223
Samples were only drawn for Bio-optics.
220
Delta-C at 20db is 0.0312. Salinity is
34.308. Salt analysis ok.
Sample from gradi-
ent area.
221
Samples were only drawn for Bio-optics.
219
Samples were only drawn for Bio-optics.
216
Delta-C at 40db is
-0.0297. Salinity is
34.402. Salt analysis ok.
Sample from gradi-
ent area.
217
Samples were only drawn for Bio-optics.
Station 021
Cast 1 Sample Log: "MIN tried new sampling
instru-
ment for Freon as an exercise."
Station 022
Cast 1
CTD: cast 2 was optics. Some
double samples
on cast 1. DLOG - 8 bottle trips in bot, 14
bottles? Edited .bot file and duplicated
missing pressure levels.
113
Samples were only drawn for Bio-optics.
114
Delta-C at 3db is -0.05.
Salinity is 33.699.
Salt analysis ok. Sample
from gradient area.
111
Samples were only drawn for Bio-optics.
109
Samples were only drawn for Bio-optics.
107
Samples were only drawn for Bio-optics.
105
Samples were only drawn for Bio-optics.
103
Samples were only drawn for Bio-optics.
101
Samples were only drawn for Bio-optics.
Station 023
109
Delta-C at 3db is -0.0828. Salinity is
33.930. Salt analysis
ok. Sample from gra-
dient area.
Station 024
102
Salt analysis required 3
attempts. Using
first value only. Delta-C
is 0.0014.
Station 025
120 Salt
analysis required 3
attempts. Using
first value only. Delta-C is 0.0132.
Station 026
101
Salt analysis required 3
attempts, using
first value only. Delta-C
at 2189db is
0.0026, Salinity =
34.069.
Station 027
123
Sample Log: "N23 closed in
air." Samples
were only drawn for Bio-optics.
122
Samples were only drawn for Bio-optics.
120
Samples were only drawn for Bio-optics.
118
Samples were only drawn for Bio-optics.
Station 028
Cast 2
Cast 1 was optics.
Some double samples on
cast 2. CTD: Edited .bot
file and duplicated
missing press levels (~15,37,50). These were
bottles 18,16,14.
220
Samples were only drawn for Bio-optics.
218
Samples were only drawn for Bio-optics.
216
Samples were only drawn for Bio-optics.
214
Samples were only drawn for Bio-optics.
207
Salt analysis required 4
attempts. Using
first salt value only. Delta-C is 0.0015.
000112 SRA
Station 029
107
Sample Log: "On N7 oxy was drawn after
ph/alk."
Station 030
124
Sample Log: "N24 leaking.
Tripped in air?"
Oxygen looks high vs other parameters, CTDO
and nearby stations. Delta-C
at 3db is
6.7238. Salinity is 34.090.
CTS code 4.
Bottle salt overlays well with surface value
from STA.031 (vs theta).
Station 031
123
Salt analysis required 4 attempts (Delta-C
was .0172) Using first value only, Delta-C is
0.006.
102
Salt analysis required 4
attempts. Using
first value only. Delta-C at 2119db is
0.0002.
Station 032
123
Delta-C at 22db is
-0.0257. Salinity is
34.320. Salt analysis ok.
Sample from gradi-
ent area.
117
Deleted O2; bad.
110
Delta-C at 1211db is 0.0028. Value high vs
other stations.
104
CTD: bottle 4 did not close. Hung on conduct-
ing cable at pylon. Sample Log: "Bottle did
not close."
103
CTD: NB3 looks like closed late.
Nuts, oxy,
salt, freon bad.
Station 033
223
Samples were only drawn for Bio-optics.
222
Delta-C at 28db is
-0.0779. Salinity is
34.225. Salt analysis
ok. Sample from gra-
dient area.
220
Samples were only drawn for Bio-optics.
218
Sample Log: "Oxy on N18 - flask 1429 added
2ml MnCl2,
added NaOH-NaI too late. Probably
bad."
Oxygen suspicious, could be
slightly
high.
215
Sample Log: "Oxy flask 1442 was broken. Used
flask 1381 for 2nd draw.
201
Delta-C at 2179db is -0.0033.
Salinity is
34.065. Salt analysis ok.
Value ok vs nearby
stations (vs theta).
Station 034
221
Samples were only drawn for Bio-optics.
215
Data sheet: "overtitrate - no end point" -
looks OK though
207
Salt analysis required 4
attempts. Using
first value only, Delta-C is 0.0011.
Station 035
118
Delta-C at 9db is
-0.0273. Salinity is
33.968. Salt analysis
ok. Sample from gra-
dient area.
Station 036
101
PO4 higher than other
nutrients; peak odd
shape.
Station 037
112
Sample Log: "Nuts tube 12 empty." DLOG: nuts
on 12 not drawn. Forgot.
Station 038
117
Samples were only drawn for Bio-optics.
116
Delta-C at 12db is
-0.0408. Salinity is
34.174. Salt analysis ok.
115
Samples were only drawn for Bio-optics.
111
No nutrient value this level; no notes; NB13
run twice so probably not drawn.
112
Samples were only drawn for Bio-optics.
109
Samples were only drawn for Bio-optics.
106
Samples were only drawn for Bio-optics.
Station 039
115
Delta-C at 11db is 0.0263. Salinity is
34.200. Salt analysis
ok. Sample from gra-
dient area.
109
Nutrients higher than adjacent Sta
040 at
this level; O2
low.
108
Nutrients same as NB7; other parameters look
different. NB7
nutrients look correct; pos-
sible dupe draw?
Station 040
224
Samples were only drawn for Bio-optics. Er-
ror was made with nutrient sample numbers.
Duplicate samples were drawn from 23, but one
was assigned to 24. Nutrient values deleted
from NB24
222
Samples were only drawn for Bio-optics.
220
Samples were only drawn for Bio-optics.
212
Sample Log: " air leak on N12."
Station 041
Cast 1
CTD: drifter 15722 deployed after station. No
details in log.
123
Delta-C at 14db is -0.2184. Salinity is
33.984. Salt analysis ok.
Sample from gradi-
ent area.
121
Delta-C at 50db is -0.027. Salinity is
34.090. Salt analysis ok.
108
Salt analysis required 3 attempts.
Using
first value only, Delta-C is 0.0007.
Station 042
123
Delta-C at 23db is 0.0841. Salinity is
34.030. Salt analysis
ok. Sample from gra-
dient area.
Station 043
115 Delta-C at 201db is
0.0206. Salt analysis ok.
Sample from gradient area.
110
Salt analysis required 4
attempts. Using
first value only, Delta-C is -0.0009.
Station 044
124
Samples were only drawn for
Bio-optics. Er-
ror was made with
nutrient sample numbers.
Duplicate samples were drawn from 23, but one
was assigned to 24.
Nutrient values deleted
from NB24
122
Samples were only drawn for Bio-optics.
120
Samples were only drawn for Bio-optics.
118
Samples were only drawn for Bio-optics.
Station 045
223
Samples were only drawn for
Bio-optics. Er-
ror was made with
nutrient sample numbers.
Duplicate samples were drawn from 24, but one
was assigned to 23.
nutrient values deleted
from NB23
220
Samples were only drawn for Bio-optics.
208
Sample Log: "Changed
MnCl2 dispenser at N8."
207
Sample Log: "Spigot pushed in on N7."
206
Salt analysis required
3 attempts (Delta-C
was 0.0028). Using first
value only, Delta-C
is 0.0007.
Station 046
115
Sample Log: "N15 changed interior spigot O-
ring after sampling."
111
O2 looks high vs other parameters.
Flag oxy-
gen questionable.
Station 048
122
Delta-C at 19db is
-0.0289. Salinity is
34.223. Salt analysis
ok. Sample from gra-
dient area.
112
Nutrient sample tube empty. Sample not drawn.
Forgot?
106
Salt analysis required 3
attempts. Using
first value
only, Delta-C is 0.0012.
Station 049
118
Samples were only drawn for Bio-optics.
119
Samples were only drawn for Bio-optics.
116
Samples were only drawn for Bio-optics.
114
Samples were only drawn for Bio-optics.
112
Samples were only drawn for Bio-optics.
Station 050
223
Samples were only drawn for Bio-optics. Er-
ror was made with nutrient sample numbers.
Duplicate samples were drawn from 24, but one
was assigned to 23. Nutrient values deleted
from NB23
222
Delta-C at 22db is
-0.0352. Salinity is
34.310. Salt value overlays well with Sta.
051 vs theta. Salt analysis
ok.
220
Samples were only drawn for Bio-optics.
205
Sample Log: "N5 leaking, vent not closed."
202
Delta-C at 1968db is
.0031. Salt analysis
ok. Salt value overlays
well with other deep
stations (056,059).
Station 054
121
Delta-C at 40db is
-0.0784. Salinity is
34.004. Salt analysis
ok. Sample from gra-
dient area.
Station 055
123-124
Sample Log: N23 and N24 were not tripped.
Cast 1
CTD: winch stop at 2400m on way up. Console
op noticed bottom trip had
not confirmed and
1st attempt at trip at 2400m failed confirm.
Carl power cycled pylon box and got to con-
firm at 2400m. CTD: Tripping problem. Two
bottom levels did not
trip. Fixed in
05501.bot file. Preliminary
CTD fit not cor-
rect for this station. CTD conductivity is
approx. 0.015
low. Bottle salts overlay well
with other deep stations.
121
Delta-C at 19db is approx. -0.1.
Salt analy-
sis ok. Sample from
gradient area.
Station 056
122
Delta-C at 63db is 0.0252. Salinity is
34.046. Salt analysis ok.
121
Delta-C at 94db is 0.0263. Salinity is
34.059. Salt analysis ok.
118
Oxygen looks high and
duplicate of 119 vs
other parameters and CTDO;
assume dupe draw.
Station 057
Cast 1
CTD: no confirm at initial
attempt to trip
bottom bottle. Power cycled Cast 2 was op-
tics. some double samples on
cast 1. CTD:
Extra bottom levels in 05701.bot
removed.
Preliminary CTD fit not correct for this sta-
tion. CTD conductivity is approx. 0.015 to
0.018 low. Bottle
salts overlay well with
other deep stations.
123
Samples were only drawn for Bio-optics.
Error was made with nutrient sample numbers.
Duplicate samples were drawn from 24, but one
was assigned to 23.
Nutrient values deleted
from NB23
122
Samples were only drawn for Bio-optics.
Station 058
Cast 1 CTD: no confirm at bottom bottle; power cy-
cled pylon box, 2nd no confirm on bottom bot-
tle. Confirmation on 4th attempt. Cycled
power 3 times. Preliminary
CTD fit not cor-
rect for this station. CTD conductivity is
approx. 0.015 low. Bottle
salts overlay well
with other deep stations.
Station 059
123
Delta-C at 14db is 0.0563. Salinity is
33.966. Salt analysis
ok. Sample from gra-
dient area.
101
Delta-C at 3211db is -0.0025.
Salinity is
34.067. Salt analysis ok. Value overlays
well with nearby stations.
Station 060
123
Delta-C at 18db is
-0.0672. Salinity is
33.948. Salt analysis
ok. Sample from gra-
dient area.
111
Salt analysis required 3
attempts. Using
first value only, Delta-C is 0.0011.
110
Ssalt analysis required
3 attempts. Using
first value only, Delta-C is 0.0009.
Station 061
224
Samples were only drawn for Bio-optics.
222
Samples were only drawn for Bio-optics.
220
Samples were only drawn for Bio-optics.
218
Samples were only drawn for Bio-optics.
205
Salt analysis required 4 attempts, Delta-C at
1513db is 0.0036.
204
Samples were only drawn for Bio-optics.
Station 062
223
Samples were only drawn for Bio-optics.
220
Samples were only drawn for Bio-optics.
218
Samples were only drawn for Bio-optics.
216 Samples were only
drawn for Bio-optics.
213
Delta-C at 121db is -0.0255.
Salinity is
34.023. Salt analysis ok.
Station 063
114
Salt analysis required 4
attempts. Using
first value only, Delta-C is 0.0024.
112
Salt analysis required 3
attempts. Using
first value only, Delta-C is 0.0017.
Station 064
Cast 1 NO3 and PO4 look
higher than nearby stations
(079, 063 & 065); Especially in the deep wa-
ter; F1s higher this station as well; Could
be working standard pipetting error. PO4 had
alot of reruns this
station, but reruns look
OK.
120
Sample Log: "N20 spigot pushed in."
101-124 See
Cast 1 nutrient comments; code NO3
ques-
tionable. See Cast 1
nutrient comments; code
PO4 questionable.
Station 066
118
oxy in bottle 2 would not titrate. contamina-
tion in sample.
Station 067
Cast 2 CTD: cast 1 was optics. some double samples
on cast 2. Sample Log:
"Sampling jumped
around, not simple 1 -> 24."
223
Samples were only drawn for Bio-optics.
221
Samples were only drawn for Bio-optics.
219
Samples were only drawn for Bio-optics.
217
Samples were only drawn for Bio-optics.
211-207
Sample Log: "N7 through N11 in sunshine."
Station 068
223 Samples
were only drawn for Bio-optics.
224
Delta-C at 3db is 0.0415. Salinity is 33.981.
Salt analysis required
3 attempts. Sample
from gradient area.
221
Samples were only drawn for Bio-optics.
222
Delta-C at 26db is 0.0321. Salinity is
34.366. Salt analysis
ok. Sample from gra-
dient area.
219
Samples were only drawn for Bio-optics.
217
Samples were only drawn for Bio-optics.
212
Sample Log: "N12 leaking. Open vent."
Station 069
113
Delta-C at 22db is
-0.0425. Salinity is
34.267. Salt analysis
ok. Sample from gra-
dient area.
107
Delta-C at 98db is 0.0416. Salinity is
34.374. Salt analysis
ok. Sample from gra-
dient area.
106
Delta-C at 123db is 0.0298. Salinity is
34.197. Salt analysis
ok. Sample from gra-
dient area.
104
Delta-C at 178db is 0.025. Salinity is
34.100. Salt analysis ok.
Station 070
117
Delta-C at 3db is
-0.0881. Salinity is
33.933. Salt analysis
ok. Sample from gra-
dient area.
118
Samples were only drawn for Bio-optics.
115
Delta-C at 17db is
-0.0733. Salinity is
34.390. Salt analysis
ok. Sample from gra-
dient area.
116
Samples were only drawn for Bio-optics.
114
Samples were only drawn for Bio-optics.
112
Samples were only drawn for Bio-optics.
110
Samples were only drawn for Bio-optics.
108
Samples were only drawn for Bio-optics.
102 Samples
were only drawn for Bio-optics.
Station 071
Cast 2
CTD: cast 1 was optics. some
double samples
on cast 2. Probably touched bottom. Bottom
bottle tripped 6m above bottom.
221
Samples were only drawn for Bio-optics.
219
Samples were only drawn for Bio-optics.
218
Delta-C at 21db is
-0.0536. Salinity is
34.306. Salt analysis
ok. Sample from gra-
dient area.
217
Samples were only drawn for Bio-optics.
215
Samples were only drawn for Bio-optics.
209
Samples were only drawn for Bio-optics.
202
O2 looks high vs other
parameters; Check
CTDO2 trace.
Station 072
112
Salt analysis required 5 attempts.
Value was
too high. Using first salt value only.
Delta-C at 606db is .0015.
Station 073
123
Delta-C at 20db is 0.0866. Salinity is
34.432. Salt analysis
ok. Sample from gra-
dient area.
Station 074
123
Delta-C at 14db is 0.0312. Salinity is
33.942. Salt analysis
ok. Sample from gra-
dient area.
121
Delta-C at 94db is
-0.0361. Salinity is
34.080. Salt analysis
ok. Sample from gra-
dient area.
Station 075
116
Delta-C at 22db is
-0.0526. Salinity is
34.242. Salt analysis
ok. Sample from gra-
dient area.
115
Delta-C at 37db is -0.052. Salinity is
34.467. Salt analysis
ok. Sample from gra-
dient area.
106
CTD: Bottle 6 did not trip. bottle 6 did con-
firm. Sample Log: "N6 did not
trip."
Station 076
Cast 1
CTD: cast 2 was optics. some
double samples
on cast 1. Downcast stopped about 2650m to
clear fouled cond sensor.
Brought up about
50m then continued down.
[LDT - bad data
starts @ 2606, reversed up at 2682, back down
at 2681]
123
Samples were only drawn for Bio-optics.
122
Samples were only drawn for Bio-optics.
106 CTD Log: "bottle 6 did not
trip. bottle 6 did
confirm." Sample Log:
"N6 came up open."
105
Salt analysis required 3 attempts. Delta-C at
2268db was 0.003. Using
first salt value
only, Delta-C now 0.0015.
104
Sample Log: "N4 sampled by optics before tri-
tium."
Station 077
223
Delta-C at 29db is 0.0704. Salinity is
34.421. Salt analysis
ok. Sample from gra-
dient area.
Station 078
122
Delta-C at 28db is
-0.0506. Salinity is
34.108. Salt analysis
ok. Sample from gra-
dient area.
Station 079
124
Samples were only drawn for Bio-optics.
122
Samples were only drawn for Bio-optics.
120
Samples were only drawn for Bio-optics.
Station 080
223
Samples were only drawn for Bio-optics.
221
Samples were only drawn for Bio-optics.
222
Delta-C at 23db is 0.0386. Salinity is
34.183. Salt analysis ok.
Sample from gradi-
ent area.
219
Samples were only drawn for Bio-optics.
218
Delta-C at 98db is 0.025. Salinity is 34.093.
Salt analysis ok. Sample from gradient area.
Station 081
102
Oxygen looks high by ~0.03ml/L vs other pa-
rameters and CTDO; no analytical notes
Station 082
123
Delta-C at 19db is
-0.0372. Salinity is
34.170. Salt analysis
ok. Sample from gra-
dient.
122
Delta-C at 44db is
-0.0365. Salinity is
34.171. Salt analysis
ok. Sample from gra-
dient.
Station 083
117
Delta-C at 197db is -0.0365.
Salinity is
34.084.
Station 084
124
Delta-C at 3db is 0.085.
Salinity is 32.453.
Salt analysis ok. Sample
from strong gradi-
ent area.
124 CFC-11 at 3 db
suspiciously low - check with Min
123
Delta-C at 12db is 0.2508. Salinity is
33.120. Salt analysis ok.
Sample from
strong gradient area.
122
Delta-C at 27db is
-0.0318. Salinity is
33.991. Salt analysis ok.
Sample from
strong gradient area.
120
Delta-C at 83db is 0.0251. Salinity is
34.165. Salt analysis ok.
Sample from
strong gradient area.
Station 085
122 Samples
were only drawn for Bio-optics.
120
Samples were only drawn for Bio-optics.
CFC-11 at 3 db suspiciously low - check with Min
117
Delta-C at 37db is
-0.0373. Salinity is
34.115. Salt analysis ok. Sample from gra-
dient area.
118
Samples were only drawn for Bio-optics.
116
Samples were only drawn for Bio-optics.
112
Samples were only drawn for Bio-optics.
110
Samples were only drawn for Bio-optics.
108
Samples were only drawn for Bio-optics.
106
Samples were only drawn for Bio-optics.
104
Samples were only drawn for Bio-optics.
102
Samples were only drawn for Bio-optics.
Station 086
104
Delta-C at 30db is
-0.0377. Salinity is
34.170. Salt analysis
ok. Sample from gra-
dient area.
103
Oxygen looks odd vs theta; looks low by
~0.2-0.3 ml/L vs other
parameters, adjacent
shallow stations, and CTDO;
however in shal-
low water and temperature gradient
so could
be real; no notes; leave for now.
Station 087
213
Samples were only drawn for Bio-optics.
211
Samples were only drawn for Bio-optics.
209
Samples were only drawn for Bio-optics.
206
Delta-C at 43db is 0.0445. Salinity is
34.205. Salt analysis
required 3 attempts.
Sample from gradient area.
207
Samples were only drawn for Bio-optics.
205
Samples were only drawn for Bio-optics.
Station 088
107
Delta-C at 23db is -0.062. Salinity is
34.035. Salt analysis
ok. Sample from gra-
dient area.
Station 089
107
Delta-C at 17db is 0.045. Salinity is 34.188.
Salt analysis ok. Sample
from gradient area.
105
Delta-C at 42db is 0.0287. Salinity is
34.317. Salt analysis
ok. Sample from gra-
dient area.
Station 092
123
Delta-C at 25db is 0.0299. Salinity is
34.014. Salt analysis
ok. Sample from gra-
dient area.
Station 093
124 Samples
were only drawn for Bio-optics.
122
Samples were only drawn for Bio-optics.
120-121
Sample Log: "N20 and N21 spigots pushed in on
boarding."
Station 094
224
Samples were only drawn for Bio-optics.
222
Delta-C at 21db is 0.0413. Salinity is
33.991. Salt analysis
ok. Sample in gradi-
ent area.
220-221
Sample Log: "N20 and N21 spigots pushed in on
boarding. They were okay before cast. After
cast, replaced spigot inner O-rings after
sampling.
204
Delta-C at 2931db is -0.0026.
Salinity is
34.065. Appears slightly
low compared to CTD
cond.
202 Sample Log: "Oxy sampling delayed on N2
(due
to Helium tube problem)."
Station 095
123
Delta-C at 10db is
-0.0639. Salinity is
33.996. Salt analysis
ok. Sample from gra-
dient area.
113
Sample Log: "Not enough water in N3 and N13
for tritium sample."
103
Sample Log: "Not enough water in N3 and N13
for tritium sample."
Station 097
123
Delta-C at 17db is -0.0552. Salinity is
34.036. Salt analysis
ok. Sample from gra-
dient area.
Station 098
224
Delta-C at 3db is
-0.0516. Salinity is
34.021. Salt analysis ok.
Sample from gradi-
ent area.
223
Samples were only drawn for Bio-optics.
221
Samples were only drawn for Bio-optics.
206
CTD Log: "Bottle 6 did not trip. bottle 6 did
confirm."
Sample Log: "N6 came up open.
Third occurence."
Station 099
224
Samples were only drawn for Bio-optics.
206
Samples were only drawn for Bio-optics.
Station 100
106
Sample Log: "N16 spigot pushed in on board-
ing."
Station 101
109
SiO3 looks high; peak OK however.
101
PO4 looks high by ~0.04uM but peak OK;
Station 103
114
Salt and nutrients not samples on NB14. No
notes.
Station 104
Cast 1
Sample log was not filled in for salinity and
nutrients. Not
certain what else could have
been missed, there were salinities and nutri-
ents drawn.
117
Salt analysis required 5 attempts. Delta-C
at 176db is -0.0071.
109-113
Sample Log: "Oxy draw temps
unsure (out of
order) N9 -> N13."
106
Sample Log: "N6 vent open."
Station 105
124
Samples were only drawn for Bio-optics.
120
Delta-C at 46db is 0.0305. Salinity is
34.142. Salt analysis
ok. Sample from gra-
dient area.
121
Samples were only drawn for Bio-optics.
116
Salt analysis required 3
attempts. Using
first value only. Delta-C
at 263db is 0.0008
(was 0.0027).
114
Salt analysis required 3
attempts. Using
first value only. Delta-C
at 404db is 0.0030
(was 0.0041).
Station 106
223
Samples were only drawn for Bio-optics.
221
Samples were only drawn for Bio-optics.
Station 107
120
Sample Log: "N20 spigot pushed in on board-
ing. Replaced spigot collar ater cast, might
make it less likely to
rotate and open spig-
ot."
104
Delta-C at 2582db is -0.003.
Salinity is
34.066. Salt analysis ok.
Overlays well
with Sta. 108/109
103
Delta-C at 2837db is -0.0037. Salinity is
34.065. Salt analysis ok.
Overlays well
with Sta. 108/109
102
Delta-C at 3040db is -0.0029. Salinity is
34.066. Salt analysis ok.
Overlays well
with Sta. 108/109
101
Delta-C at 3214db is -0.0034. Salinity is
34.066. Salt analysis ok.
Overlays well
with Sta. 108/109
Station 108
123
Delta-C at 31db is 0.0658. Salinity is
34.123. Salt analysis
ok. Sample from gra-
dient area.
Station 109
122
Delta-C at 54db is
-0.0375. Salinity is
34.076. Salt analysis
ok. Sample from gra-
dient area.
119
Salt analysis required 3
attempts. Using
first value only. Delta-C
at 246db is 0.0026
(was 0.0037).
Station 110
224
Samples were only drawn for Bio-optics.
Station 111
105
Delta-C at 2534db is -0.0027. Salinity is
34.066. Salt analysis ok. Samples overlay
well w/ Sta.110/112
103
Delta-C at 3145db is -0.0025. Salinity is
34.067. Salt analysis ok. Samples overlay
well w/ Sta.110/112
102
Delta-C at 3451db is -0.003.
Salinity is
34.067. Salt analysis ok. Samples overlay
well w/ Sta.110/112
101
Delta-C at 3689db is -0.0029. Salinity is
34.067. Salt analysis ok. Samples overlay
well w/ Sta.110/112
Station 112
123
Delta-C at 31db is 0.0356. Salinity is
34.040. Salt analysis
ok. Sample from gra-
dient area.
112
O2 low, no obvious reason, possible dupe draw
of 111, salt very slight
indication of simi-
lar problem, nothing in nuts indicating leak
or problem.
Station 113
123
Delta-C at 3db is
-0.0684. Salinity is
33.828. Salt analysis
ok. Sample from gra-
dient area.
123-115
O2 and Nutrients not drawn. Test
cast for
new CTD sensor.
124
Samples were only drawn for Freon blanks.
111 Samples were
only drawn for Freon blanks.
112
O2 and Nutrients not drawn.
Test cast for
new CTD sensor.
113
No samples taken.
114
No samples taken.
106
Samples were only drawn for Freon blanks
107
O2 and Nutrients not drawn. Test
cast for
new CTD sensor.
108
No samples taken.
109
No samples taken.
110
No samples taken.
102
Samples were only drawn for Freon blanks.
103
No samples taken.
104
No samples taken.
101
O2 and Nutrients not drawn.
Test cast for
new CTD sensor.
105
No samples taken.